Map layer that draws the edges of a (sf)network.
Usage
tm_edges(
  col = tmap::tm_const(),
  col.scale = tmap::tm_scale(),
  col.legend = tmap::tm_legend(),
  col.free = NA,
  lwd = tmap::tm_const(),
  lwd.scale = tmap::tm_scale(),
  lwd.legend = tmap::tm_legend(),
  lwd.free = NA,
  lty = tmap::tm_const(),
  lty.scale = tmap::tm_scale(),
  lty.legend = tmap::tm_legend(),
  lty.free = NA,
  col_alpha = tmap::tm_const(),
  col_alpha.scale = tmap::tm_scale(),
  col_alpha.legend = tmap::tm_legend(),
  col_alpha.free = NA,
  from = 0,
  to = 1,
  linejoin = "round",
  lineend = "round",
  plot.order = tmap::tm_plot_order("lwd", reverse = TRUE, na.order = "bottom"),
  zindex = NA,
  group = NA,
  group.control = "check",
  popup = tmap::tm_popup(),
  popup.vars = NA,
  popup.format = list(),
  hover = NA,
  id = "",
  options = opt_tm_edges(),
  ...
)

opt_tm_edges(lines.only = "yes", offset_start = 0, offset_end = 0)
Arguments
- col, col.scale, col.legend, col.free
Visual variable that determines the col color. See details.
- lwd, lwd.scale, lwd.legend, lwd.free
Visual variable that determines the line width. See details.
- lty, lty.scale, lty.legend, lty.free
Visual variable that determines the line type. See details.
- col_alpha, col_alpha.scale, col_alpha.legend, col_alpha.free
Visual variable that determines the border color alpha transparency. See details.
- from, to
Numbers between 0 and 1 (where
to >= from) that indicate which part of each edge is drawn. By default full lines, sofromandtoare respectively 0 and 1.- linejoin, lineend
line join and line end. See
gparfor details.- plot.order
Specification in which order the spatial features are drawn. See
tmap::tm_plot_orderfor details.- zindex
Map layers are drawn on top of each other. The
zindexnumbers (one for each map layer) determines the stacking order. By default the map layers are drawn in the order they are called.- group
Name of the group to which this layer belongs. This is only relevant in view mode, where layer groups can be switched (see
group.control)- group.control
In view mode, the group control determines how layer groups can be switched on and off. Options:
"radio"for radio buttons (meaning only one group can be shown),"check"for check boxes (so multiple groups can be shown), and"none"for no control (the group cannot be (de)selected).- popup
popup specification for
"view"mode, the output oftmap::tm_popup(). It determines the data variables shown in the popup table, the popup title, and the popup layout. This replaces the deprecated argumentspopup.varsandpopup.format.- popup.vars
(Deprecated.) Use
popupwithtmap::tm_popup()instead (via itsvarsargument). Names of data variables that are shown in the popups in"view"mode. Setpopup.varstoTRUEto show all variables in the shape object. Setpopup.varstoFALSEto disable popups. Setpopup.varsto a character vector of variable names to show those variables in the popups. The default (NA) depends on whether visual variables (e.g.col) are used. If so, only those are shown. If not, all variables in the shape object are shown.- popup.format
(Deprecated.) Use
popupwithtmap::tm_popup()instead (via itsformatargument). List of formatting options for the popup values. See the argumentlegend.formatfor options. Only applicable for numeric data variables. If one list of formatting options is provided, it is applied to all numeric variables ofpopup.vars. Also, a (named) list of lists can be provided. In that case, each list of formatting options is applied to the named variable.- hover
name of the data variable that specifies the hover labels (view mode only). Set to
FALSEto disable hover labels. By defaultFALSE, unlessidis specified. In that case, it is set toid,- id
name of the data variable that specifies the indices of the spatial features. Only used for
"view"mode.- options
options passed on to the corresponding
opt_<layer_function>function- ...
passed on to
tmap::tm_lines().- lines.only
should only line geometries of the shape object (defined in
tmap::tm_shape()) be plotted, or also other geometry types (like polygons)? By default"ifany", which meansTRUEin case a geometry collection is specified.- offset_start, offset_end
Offset in coordinates (usually meters) of the start and end points.
Value
a tmap::tmap-element, supposed to be stacked after tmap::tm_shape() using the + operator. The opt_<layer_function> function returns a list that should be passed on to the options argument.
Examples
library(tmap)
library(sfnetworks)
sfn = as_sfnetwork(roxel)
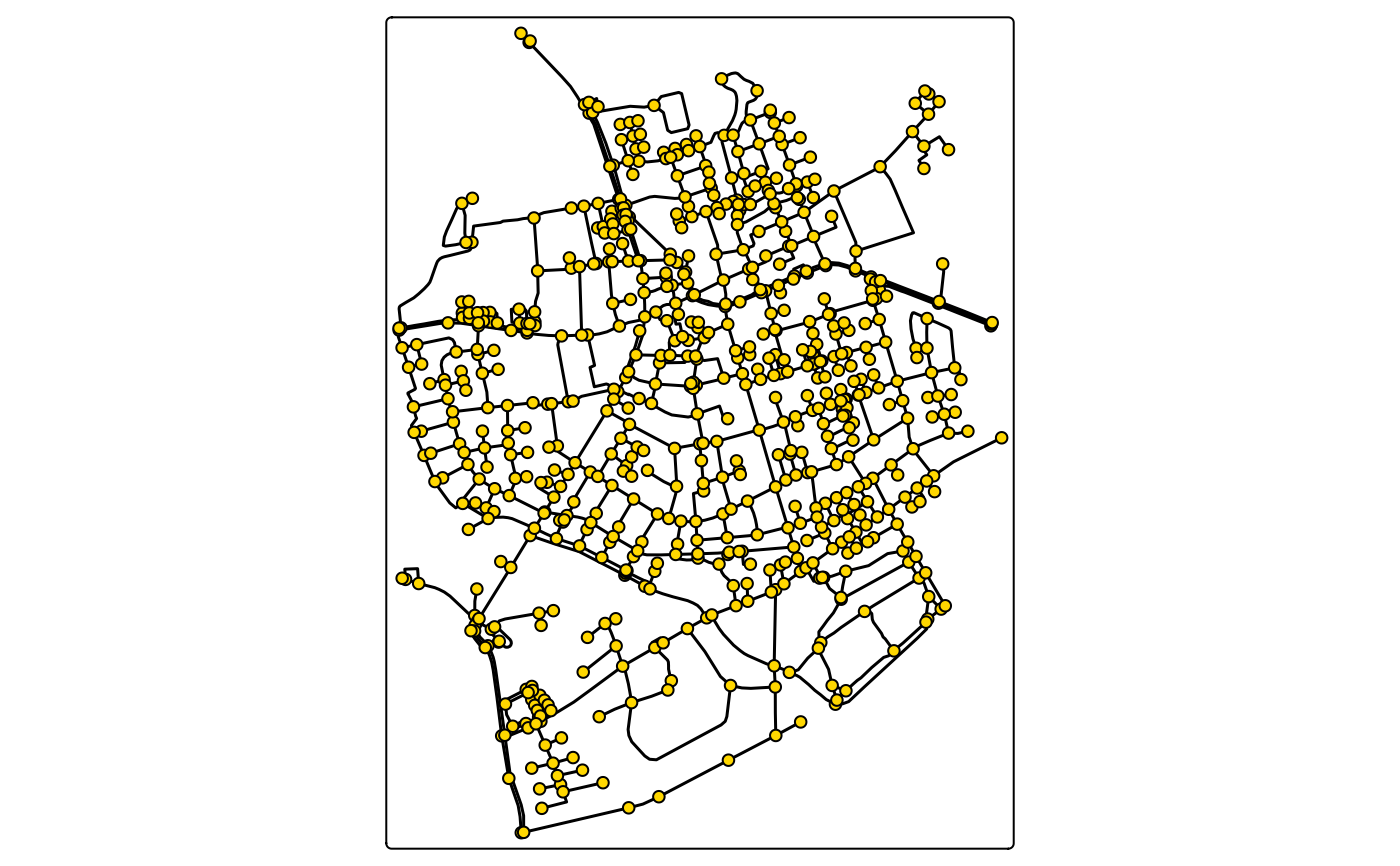
tm_shape(sfn) +
tm_network()
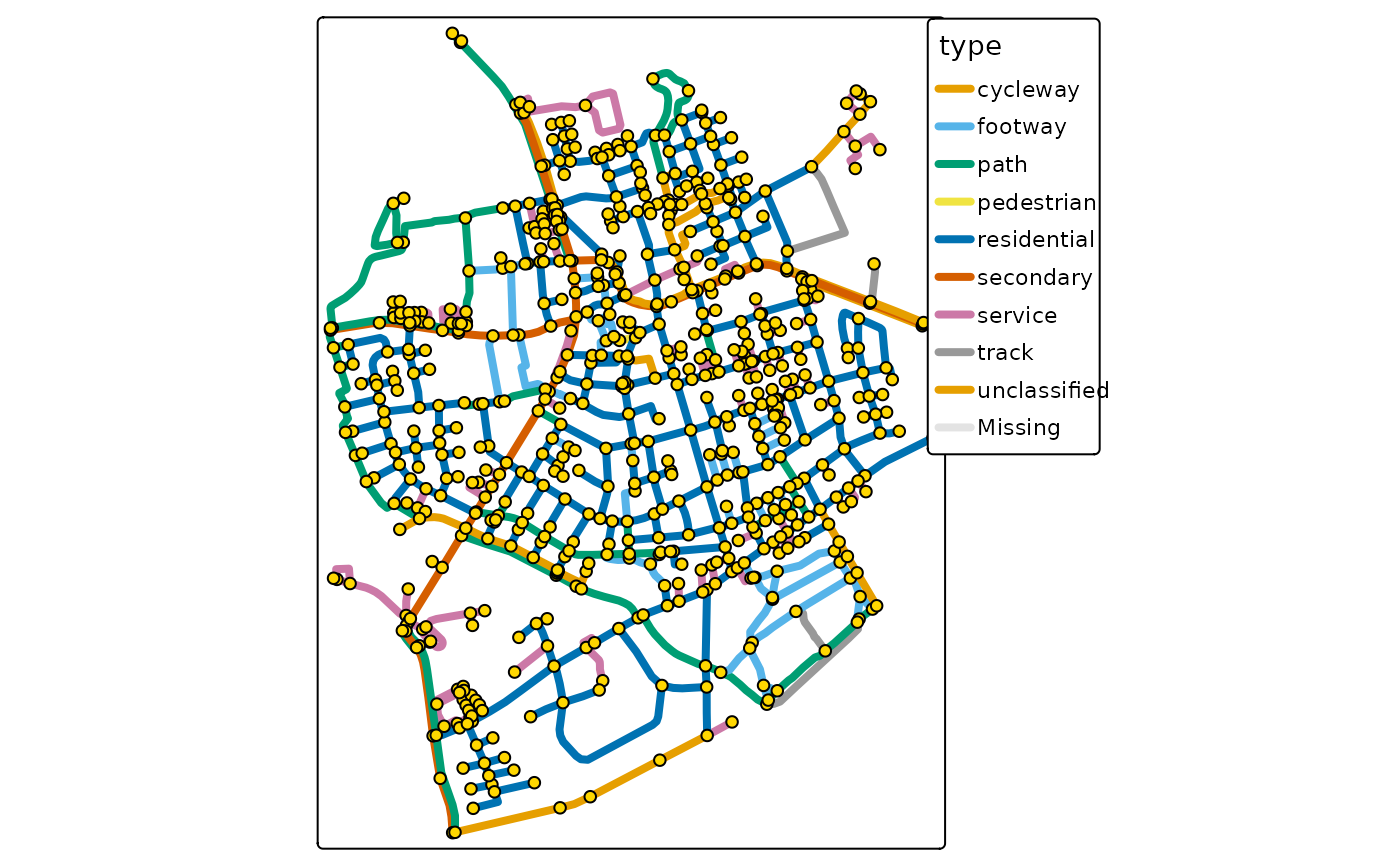
 tm_shape(sfn) +
tm_edges(col = "type", lwd = 4) +
tm_nodes()
tm_shape(sfn) +
tm_edges(col = "type", lwd = 4) +
tm_nodes()
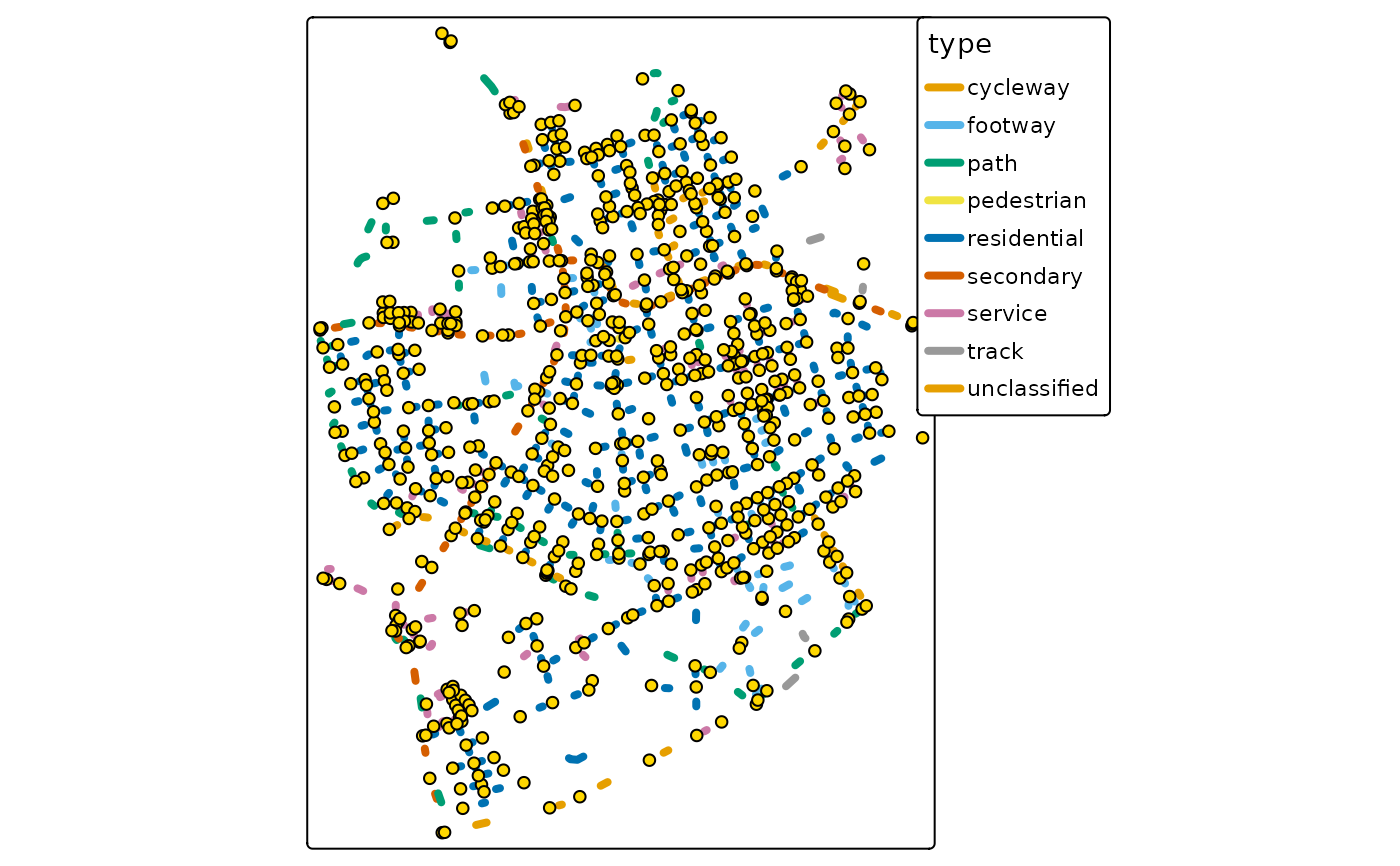
 tm_shape(sfn) +
tm_edges(col = "type", lwd = 4, from = 0.3, to = 0.4) +
tm_nodes()
#> Linking to GEOS 3.12.1, GDAL 3.8.4, PROJ 9.4.0; sf_use_s2() is TRUE
tm_shape(sfn) +
tm_edges(col = "type", lwd = 4, from = 0.3, to = 0.4) +
tm_nodes()
#> Linking to GEOS 3.12.1, GDAL 3.8.4, PROJ 9.4.0; sf_use_s2() is TRUE