Map layer that draws the nodes of a (sf)network.
Usage
tm_nodes(
  size = tm_const(),
  size.scale = tm_scale(),
  size.legend = tm_legend(),
  size.free = NA,
  fill = tm_const(),
  fill.scale = tm_scale(),
  fill.legend = tm_legend(),
  fill.free = NA,
  col = tm_const(),
  col.scale = tm_scale(),
  col.legend = tm_legend(),
  col.free = NA,
  shape = tm_const(),
  shape.scale = tm_scale(),
  shape.legend = tm_legend(),
  shape.free = NA,
  lwd = tm_const(),
  lwd.scale = tm_scale(),
  lwd.legend = tm_legend(),
  lwd.free = NA,
  lty = tm_const(),
  lty.scale = tm_scale(),
  lty.legend = tm_legend(),
  lty.free = NA,
  fill_alpha = tm_const(),
  fill_alpha.scale = tm_scale(),
  fill_alpha.legend = tm_legend(),
  fill_alpha.free = NA,
  col_alpha = tm_const(),
  col_alpha.scale = tm_scale(),
  col_alpha.legend = tm_legend(),
  col_alpha.free = NA,
  plot.order = tm_plot_order("size"),
  zindex = NA,
  group = NA,
  group.control = "check",
  popup = tm_popup(),
  popup.vars = NA,
  popup.format = list(),
  hover = NA,
  id = "",
  options = opt_tm_nodes(),
  ...
)

opt_tm_nodes(
  points_only = "yes",
  point_per = "feature",
  on_surface = FALSE,
  clustering = FALSE,
  icon.scale = 3,
  just = NA,
  grob.dim = c(width = 48, height = 48, render.width = 256, render.height = 256)
)
Arguments
- size, size.scale, size.legend, size.free
Visual variable that determines the size. See details.
- fill, fill.scale, fill.legend, fill.free
Visual variable that determines the fill color. See details.
- col, col.scale, col.legend, col.free
Visual variable that determines the col color. See details.
- shape, shape.scale, shape.legend, shape.free
Visual variable that determines the shape. See details.
- lwd, lwd.scale, lwd.legend, lwd.free
Visual variable that determines the line width. See details.
- lty, lty.scale, lty.legend, lty.free
Visual variable that determines the line type. See details.
- fill_alpha, fill_alpha.scale, fill_alpha.legend, fill_alpha.free
Visual variable that determines the fill color alpha transparency See details.
- col_alpha, col_alpha.scale, col_alpha.legend, col_alpha.free
Visual variable that determines the border color alpha transparency. See details.
- plot.order
Specification in which order the spatial features are drawn. See
tmap::tm_plot_orderfor details.- zindex
Map layers are drawn on top of each other. The
zindexnumbers (one for each map layer) determines the stacking order. By default the map layers are drawn in the order they are called.- group
Name of the group to which this layer belongs. This is only relevant in view mode, where layer groups can be switched (see
group.control)- group.control
In view mode, the group control determines how layer groups can be switched on and off. Options:
"radio"for radio buttons (meaning only one group can be shown),"check"for check boxes (so multiple groups can be shown), and"none"for no control (the group cannot be (de)selected).- popup
popup specification for
"view"mode, the output oftmap::tm_popup(). It determines the data variables shown in the popup table, the popup title, and the popup layout. This replaces the deprecated argumentspopup.varsandpopup.format.- popup.vars
(Deprecated.) Use
popupwithtmap::tm_popup()instead (via itsvarsargument). Names of data variables that are shown in the popups in"view"mode. Setpopup.varstoTRUEto show all variables in the shape object. Setpopup.varstoFALSEto disable popups. Setpopup.varsto a character vector of variable names to show those variables in the popups. The default (NA) depends on whether visual variables (e.g.col) are used. If so, only those are shown. If not, all variables in the shape object are shown.- popup.format
(Deprecated.) Use
popupwithtmap::tm_popup()instead (via itsformatargument). List of formatting options for the popup values. See the argumentlegend.formatfor options. Only applicable for numeric data variables. If one list of formatting options is provided, it is applied to all numeric variables ofpopup.vars. Also, a (named) list of lists can be provided. In that case, each list of formatting options is applied to the named variable.- hover
name of the data variable that specifies the hover labels (view mode only). Set to
FALSEto disable hover labels. By defaultFALSE, unlessidis specified. In that case, it is set toid,- id
name of the data variable that specifies the indices of the spatial features. Only used for
"view"mode.- options
options passed on to the corresponding
opt_<layer_function>function- ...
passed on to
tmap::tm_symbols().- points_only
should only point geometries of the shape object (defined in
tmap::tm_shape()) be plotted? By default"ifany", which meansTRUEin case a geometry collection is specified.- point_per
specification of how spatial points are mapped when the geometry is a multi line or a multi polygon. One of
"feature","segment"or"largest". The first generates a spatial point for every feature, the second for every segment (i.e. subfeature), the third only for the largest segment (subfeature). Note that the last two options can be significant slower.- on_surface
In case of polygons, centroids are computed. Should the points be on the surface? If
TRUE, which is slower than the defaultFALSE, centroids outside the surface are replaced with points computed withsf::st_point_on_surface().- clustering
in interactive modes (e.g.
"view"mode), should clustering be applied at lower zoom levels? EitherFALSE(default),TRUE, or a mode specific specification, e.g. for"view"modemarkerClusterOptions.- icon.scale
scaling number that determines how large the icons (or grobs) are in plot mode in comparison to proportional symbols (such as bubbles). For view mode, use the argument
grob.dim- just
not used (yet)
- grob.dim
vector of four values that determine how grob objects (see details) are shown in view mode. The first and second value are the width and height of the displayed icon. The third and fourth value are the width and height of the rendered png image that is used for the icon. Generally, the third and fourth value should be large enough to render a ggplot2 graphic successfully. Only needed for the view mode.
Value
a tmap::tmap-element, supposed to be stacked after tmap::tm_shape() using the + operator. The opt_<layer_function> function returns a list that should be passed on to the options argument.
Examples
library(tmap)
library(sfnetworks)
sfn = as_sfnetwork(roxel)
tm_shape(sfn) +
tm_network()
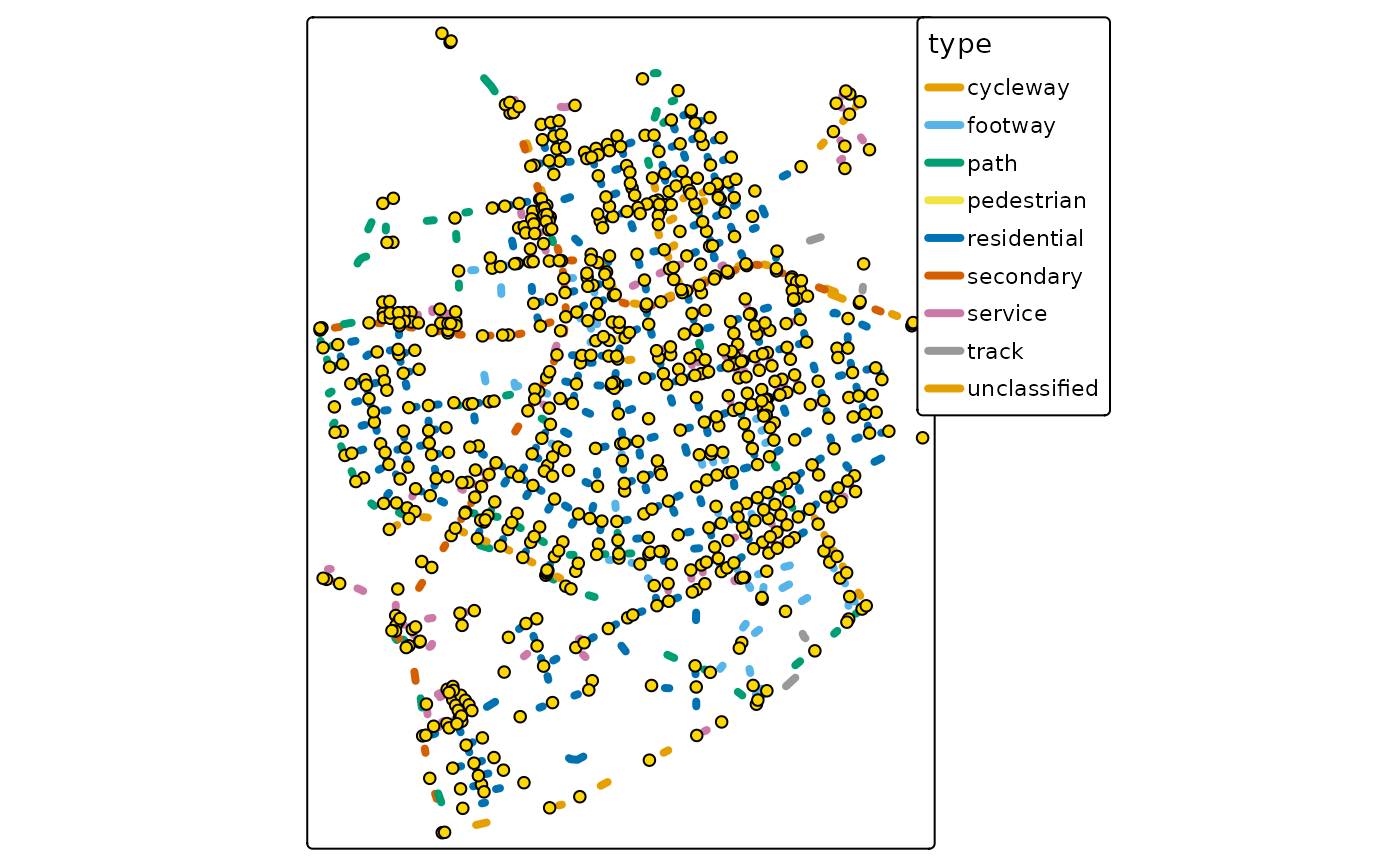
 tm_shape(sfn) +
tm_edges(col = "type", lwd = 4) +
tm_nodes()
tm_shape(sfn) +
tm_edges(col = "type", lwd = 4) +
tm_nodes()
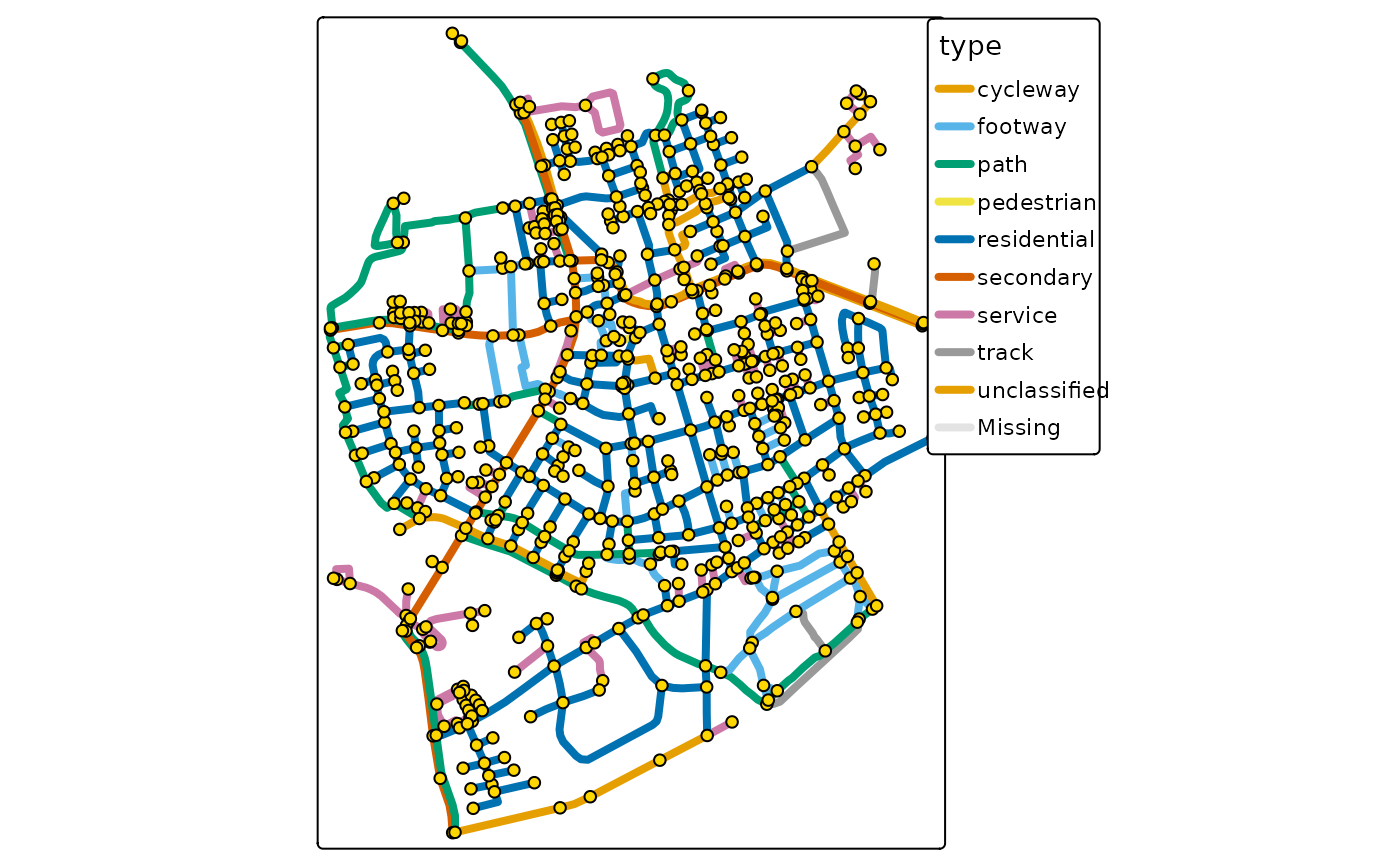 tm_shape(sfn) +
tm_edges(col = "type", lwd = 4, from = 0.3, to = 0.4) +
tm_nodes()
tm_shape(sfn) +
tm_edges(col = "type", lwd = 4, from = 0.3, to = 0.4) +
tm_nodes()