Legend specification
Usage
tm_legend(
  title,
  show,
  orientation,
  reverse,
  na.show,
  position,
  group_id,
  width,
  height,
  z,
  title.color,
  title.size,
  title.fontface,
  title.fontfamily,
  title.alpha,
  title.padding,
  title.align,
  text.color,
  text.size,
  text.fontface,
  text.fontfamily,
  text.alpha,
  format,
  frame,
  frame.color,
  frame.alpha,
  frame.lwd,
  frame.r,
  bg,
  bg.color,
  bg.alpha,
  absolute_fontsize,
  item.height,
  item.width,
  item.space,
  item.na.height,
  item.na.width,
  item.na.space,
  item.shape,
  ticks,
  ticks.disable.na,
  ticks.col,
  ticks.lwd,
  margins,
  item_text.margin,
  dot.value,
  dot.unit,
  ...
)

tm_legend_hide()

tm_legend_combine(variable)

tm_legend_cross(variable, title = "", xlab = NA, ylab = NA, ...)

tm_legend_bivariate(
  xlab,
  ylab,
  xlab.color,
  xlab.size,
  xlab.rot,
  xlab.fontface,
  xlab.fontfamily,
  xlab.alpha,
  xlab.padding,
  xlab.align,
  ylab.color,
  ylab.size,
  ylab.rot,
  ylab.fontface,
  ylab.fontfamily,
  ylab.alpha,
  ylab.padding,
  ylab.align,
  ...
)
Arguments
- title
Legend title. For
tm_legend_cross(), the title of the cross legend (by default none).- show
Show legend?
- orientation
Orientation of the legend:
"portrait"or"landscape"- reverse
Should the legend items be reversed?
- na.show
Show
NAvalues in legend?- position
The position specification of the component: an object created with
tm_pos_in()ortm_pos_out(). Or, as a shortcut, a vector of two values, specifying the x and y coordinates. The first is"left","center"or"right"(or upper case, meaning tighter to the map frame), the second"top","center"or"bottom". Numeric values are also supported, where 0, 0 means left bottom and 1, 1 right top. See also vignette: Positioning of components. In case multiple components should be combined (stacked), usegroup_idand specifycomponentintm_components().- group_id
Component group id name. All components (e.g. legends, titles, etc) with the same
group_idwill be grouped. The specifications of how they are placed (e.g. stacking, margins etc.) are determined intm_components()where its argumentidshould correspond togroup_id.- width
Width of the legend. Units are 'text line heights'. In case a negative number is specified, the units are (approximate) pixels. The relation between these two is configured via the option
absolute_fontsize.- height
Height of the legend. Units are 'text line heights'. In case a negative number is specified, the units are (approximate) pixels. The relation between these two is configured via the option
absolute_fontsize.- z
z index, e.g. the place of the component relative to the other componets
- title.color
The color of the title of the legend.
- title.size
The size of the title of the legend.
- title.fontface
The font face of the title of the legend. See
graphics::par, option 'font'.- title.fontfamily
The font family of the title of the legend. See
graphics::par, option 'family'.- title.alpha
The alpha transparency of the title of the legend.
- title.padding
The padding of the title of the legend. A vector of 4 values: bottom, left, top, right. The unit is the device height (for bottom and top) or width (for left and right).
- title.align
The align of the title of the legend.
- text.color
The color of the text of the legend.
- text.size
The size of the text of the legend.
- text.fontface
The font face of the text of the legend. See
graphics::par, option 'font'.- text.fontfamily
The font family of the text of the legend. See
graphics::par, option 'family'.- text.alpha
The alpha transparency of the text of the legend.
- format
Not used anymore: use the format argument of the
tm_scale_*()functions instead.- frame
frame should a frame be drawn?
- frame.color
frame color
- frame.alpha
frame alpha transparancy
- frame.lwd
frame line width
- frame.r
Radius of the rounded frame corners. 0 means no rounding.
- bg
Show background?
- bg.color
The color of the bg of the legend.
- bg.alpha
The alpha transparency of the bg of the legend.
- absolute_fontsize
The absolute fontsize of the legend. So far, only used to calculate legend dimensions
- item.height
The height of the item of the legend.
- item.width
The width of the item of the legend.
- item.space
The space of the item of the legend. In terms of number of text line heights.
- item.na.height
The height of the na item of the legend.
- item.na.width
The width of the na item of the legend.
- item.na.space
The space of the na item of the legend. In terms of number of text line heights.
- item.shape
The shape of the item of the legend.
- ticks
List of vectors of size 2 that determines a tick mark line (for portrait legends). The values are the y-values of begin and endpoint of a tick mark. For a solid line, only one vector is required, for dashed lines one for each dash. See vignette: tmap vs ggplot2.
- ticks.disable.na
Remove ticks for
NAvalues- ticks.col
The color of the ticks of the legend.
- ticks.lwd
The line width of the ticks of the legend. See
graphics::par, option 'lwd'.- margins
The margins of the legend. A vector of 4 values: bottom, left, top, right. The unit is the device height (for bottom and top) or width (for left and right).
- item_text.margin
The margin of the space between item and text of the legend.
- dot.value
For dot density maps: a note below the legend items that shows how many units one dot represents, e.g.
"1 dot \u2248 {n} inhabitants", where{n}is replaced by the number.TRUEshows"1 dot \u2248 {n}". Only for the legend ofpattern_densityoftm_polygons()with a dot pattern ("dots","stipple","circles", or"crosses") and a scale for which the number of dots is proportional to the data values, i.e.tm_scale_continuous_area(). The number depends on the map scale: it is computed at the center of the map when the map is drawn, and in view mode it is updated after zooming. The note is not shown when the area scale varies too much across the map (use an equal-area projection for small-scale maps).- dot.unit
The area unit of the data values (per area), e.g.
"km2","ha", or"mi2". By default, it is taken from the units of the data variable (see the units package), and otherwise"km2".- ...
visual values, e.g.
col,fill,lwd, can be specified. If so, they overrule the default visual values, which are determined by the drawn map objects (e.g. polygons)- variable
visual (or transformation) variable to combine (
tm_legend_combine()) or cross (tm_legend_cross()) the legend with: e.g."fill"or"size"- xlab
label for the x dimension (rows). For
tm_legend_cross(), the label of the columns, by default the title of the legend ofvariable.- ylab
label for the y dimension (columns). For
tm_legend_cross(), the label of the rows, by default the title of the legend of the map variable itself.- xlab.color
The color of the xlab of the legend.
- xlab.size
The size of the xlab of the legend.
- xlab.rot
The rot of the xlab of the legend.
- xlab.fontface
The font face of the xlab of the legend. See
graphics::par, option 'font'.- xlab.fontfamily
The font family of the xlab of the legend. See
graphics::par, option 'family'.- xlab.alpha
The alpha transparency of the xlab of the legend.
- xlab.padding
The padding of the xlab of the legend. A vector of 4 values: bottom, left, top, right. The unit is the device height (for bottom and top) or width (for left and right).
- xlab.align
The align of the xlab of the legend.
- ylab.color
The color of the ylab of the legend.
- ylab.size
The size of the ylab of the legend.
- ylab.rot
The rot of the ylab of the legend.
- ylab.fontface
The font face of the ylab of the legend. See
graphics::par, option 'font'.- ylab.fontfamily
The font family of the ylab of the legend. See
graphics::par, option 'family'.- ylab.alpha
The alpha transparency of the ylab of the legend.
- ylab.padding
The padding of the ylab of the legend. A vector of 4 values: bottom, left, top, right. The unit is the device height (for bottom and top) or width (for left and right).
- ylab.align
The align of the ylab of the legend.
Details
tm_legend_cross() crosses the legend of a map variable with the legend of another map variable
(variable) of the same layer: the legend items are placed in a grid, with the items of the map variable in
the rows and the items of variable in the columns, such that each cell shows a combination of both. It is
meant for two map variables of different data variables that can be combined in one symbol, such as fill
and pattern of tm_polygons(): e.g. pattern.legend = tm_legend_cross("fill"). The legend of variable
is not shown. Both legends should consist of separate items (so not a continuous color gradient). In
contrast, tm_legend_combine() merges the legends of two map variables of the same data variable into one
list of items. The labels of the columns are rotated when they do not fit. The cross legend is portrait
only.
Examples
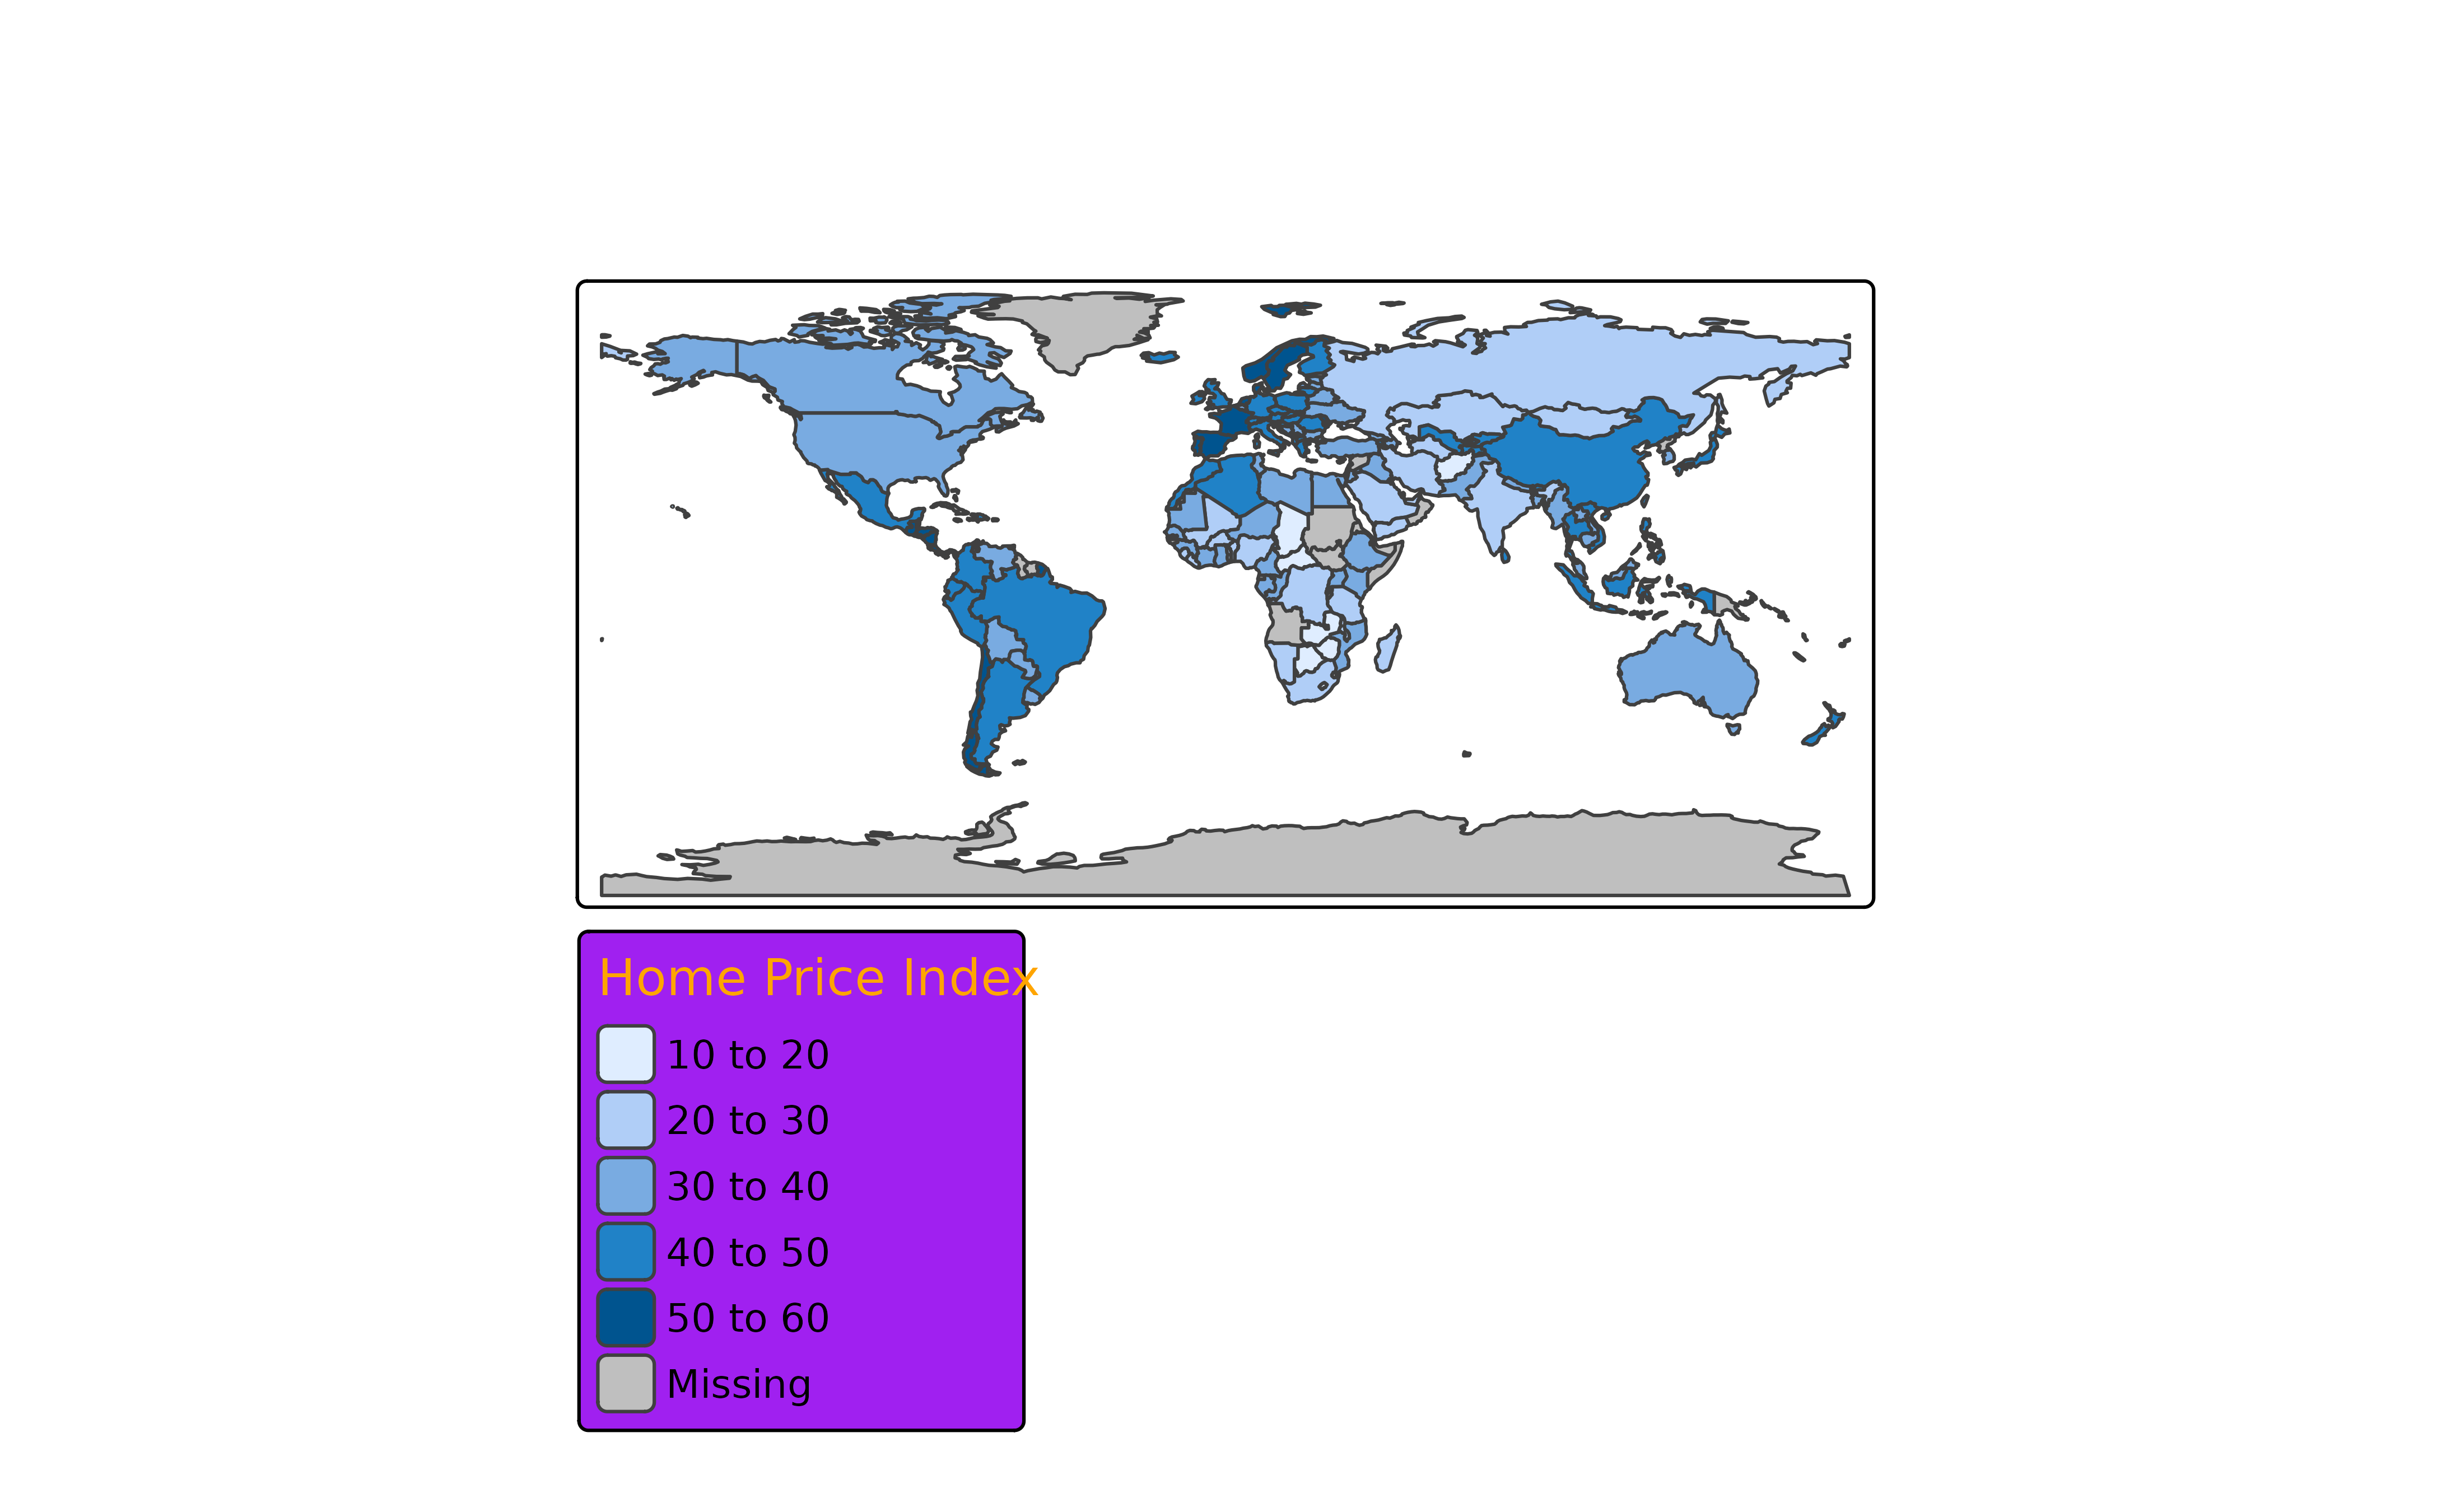
# Example using different settings from tm_legend()

tm_shape(World) +
  tm_polygons(
    fill = "HPI",
    fill.legend = tm_legend(
      title = "Home Price Index",
      title.color = "orange",
      bg.color = "purple",
      show = TRUE
  ),
    id = "name",
    # Format the labels using dollar sign
    fill.scale = tm_scale_intervals(
      label.format = function(x) format(x, big.mark = " ")),
)
#> `tm_format_label()` when `fun` is defined and `interval.disjoint` is enabled,
#> it is unclear how to format the "to" numbers, and moreover how to determine the
#> significant number of digits. Please use `digits` to set this.