tmap is an R package for drawing thematic maps. The API is based on [A Layered Grammar of Graphics][4] and resembles the syntax of [ggplot2][3], a popular R-library for drawing charts.
Installation
Installation of tmap (version 4) is straightforward:
# install.packages("remotes")
install_github("r-tmap/tmap")

# On Linux, with pak
# install.packages("pak")
pak::pak("r-tmap/tmap")

# Or from r-universe
install.packages("tmap", repos = c("https://r-tmap.r-universe.dev", "https://cloud.r-project.org"))
The old version of tmap (version 3) is available on , but we recommend to use version 4, which will be on CRAN soon.
For Linux and macOS users who are new to working with spatial data in R, this may fail since additional (non-R) libraries are required (which are automatically installed for Windows users).
Windows No additional installation required.
Linux (Ubuntu) See https://geocompx.org/post/2020/installing-r-spatial-packages-linux/. Please address installation issues in this issue.
macOS See https://www.kyngchaos.com/. Please address installation issues in this issue.
Getting started
Plot a World map of the happy planet index (HPI) per country. The object World is an example spatial data (sf) object that is contained in tmap:
tm_shape(World) +
    tm_polygons(fill = "HPI")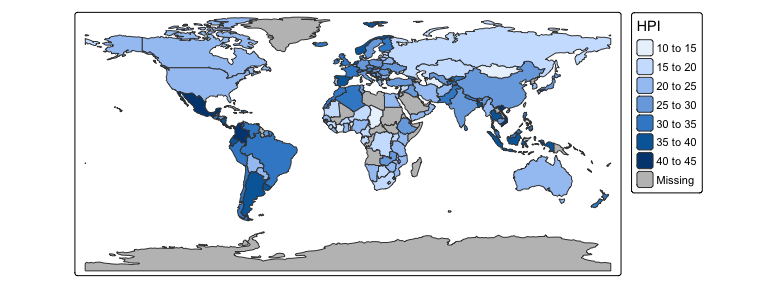
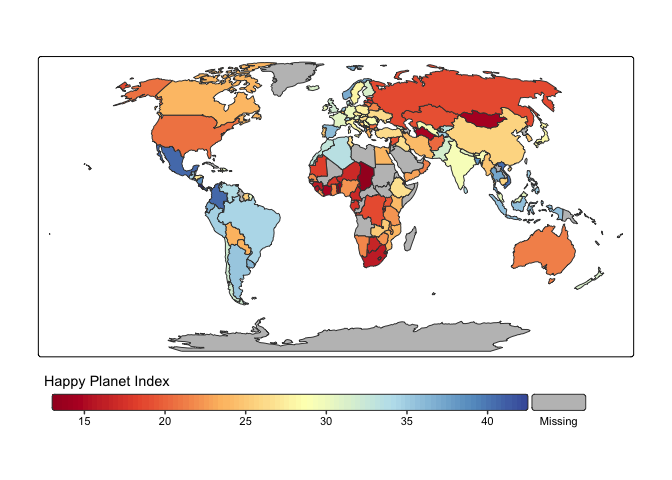
This map can be enhanced in several ways. For instance:
tm_shape(World, crs = "+proj=robin") +
    tm_polygons(fill = "HPI",
                fill.scale = tm_scale_continuous(values = "matplotlib.rd_yl_bu"),
                fill.legend = tm_legend(title = "Happy Planet Index",
                                        orientation = "landscape",
                                        frame = FALSE)
                )