Glyphs in spatial data visualization are graphical symbols that represent data values at specific geographic locations. Each glyph can encode multiple data variables.
With the extension package tmap.glyphs (in development) glyphs can be created. Currently the donut, the pie and the flower glyphs are implemented. More will follow.
In this example we explore the proportion of low, middle and high
incomes in Zuid-Holland, a province of the Netherlands (including The
Hague and Rotterdam). We use the dataset NLD_muni from
tmap, where we apply a filter and subsequently derive the
percentage of middle income:
ZH_muni = NLD_muni[NLD_muni$province == "Zuid-Holland", ]
ZH_muni$income_middle = 100 - ZH_muni$income_high - ZH_muni$income_low
Pie maps
Pie maps are (just) a special case of donut maps.
tm_shape(ZH_muni) +
  tm_polygons() +
  tm_pies(parts = tm_vars(c("income_low", "income_middle", "income_high"), multivariate = TRUE),
    fill.scale = tm_scale_categorical(values = "-pu_gn_div"),
    size = "population",
    lwd = 1,
    size.scale = tm_scale_continuous(ticks = c(50000, 100000, 250000, 500000)))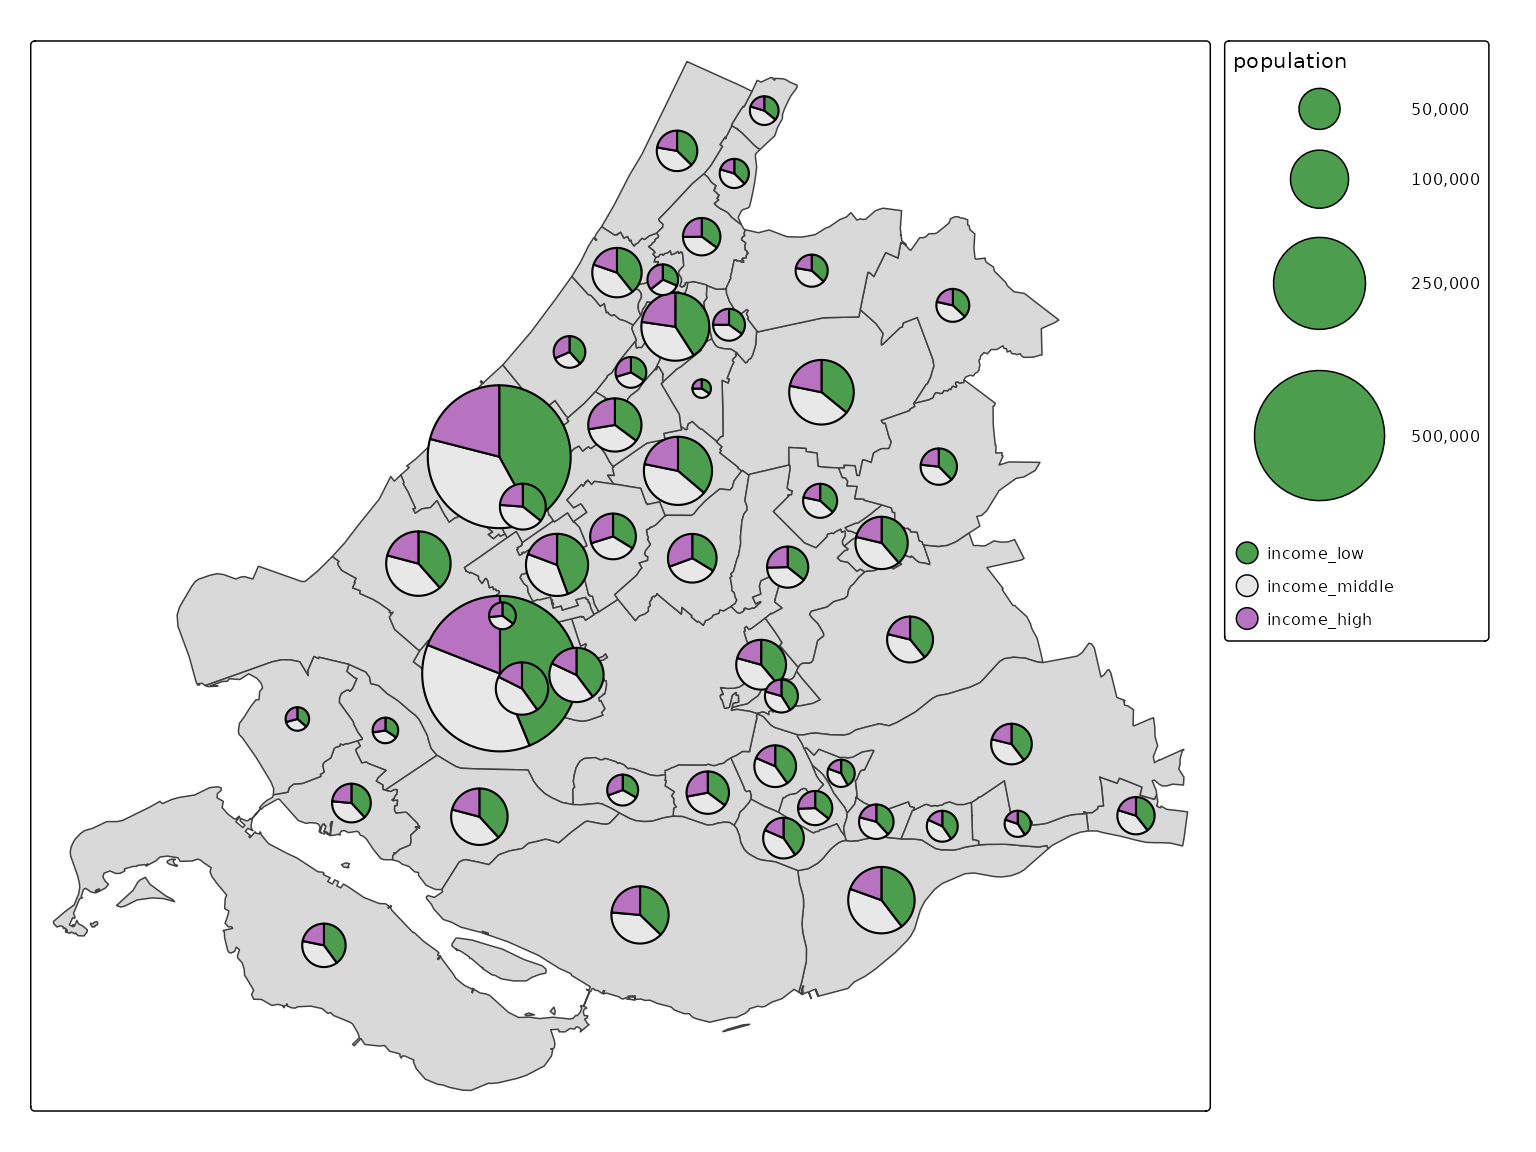
Explanation:
- The visual variable
partsis needed to determine the cut the pies. Note that a multivariate variable is required (see vignette). - The fill colors of the parts are specified via
fill.scale(and not viaparts). The used scale should be a categorical; each part represents a category. - The visual variable
sizerepresents the overall sizes of the pies.
Donut maps
Pies are just a specific case of the more general donuts.
tm_shape(ZH_muni) +
  tm_polygons() +
  tm_donuts(
    parts = tm_vars(c("income_low", "income_middle", "income_high"), multivariate = TRUE),
    fill.scale = tm_scale_categorical(values = "-pu_gn_div"),
    size = "population",
    lwd = 1,
    size.scale = tm_scale_continuous(ticks = c(50000, 100000, 250000, 500000)))
Via the argument options, several properties of the
donuts can be specified:
tm_shape(ZH_muni) +
  tm_polygons() +
  tm_donuts(
    parts = tm_vars(c("income_low", "income_middle", "income_high"), multivariate = TRUE),
    fill.scale = tm_scale_categorical(values = c("limegreen", "steelblue", "brown"), value.neutral = "grey50"),
    size = "population",
    lwd = 1,
    size.scale = tm_scale_continuous(ticks = c(50000, 100000, 250000, 500000)),
    options = opt_tm_donuts(start = 45, direction = -1, inner = 0.2, fill_hole = "orange"))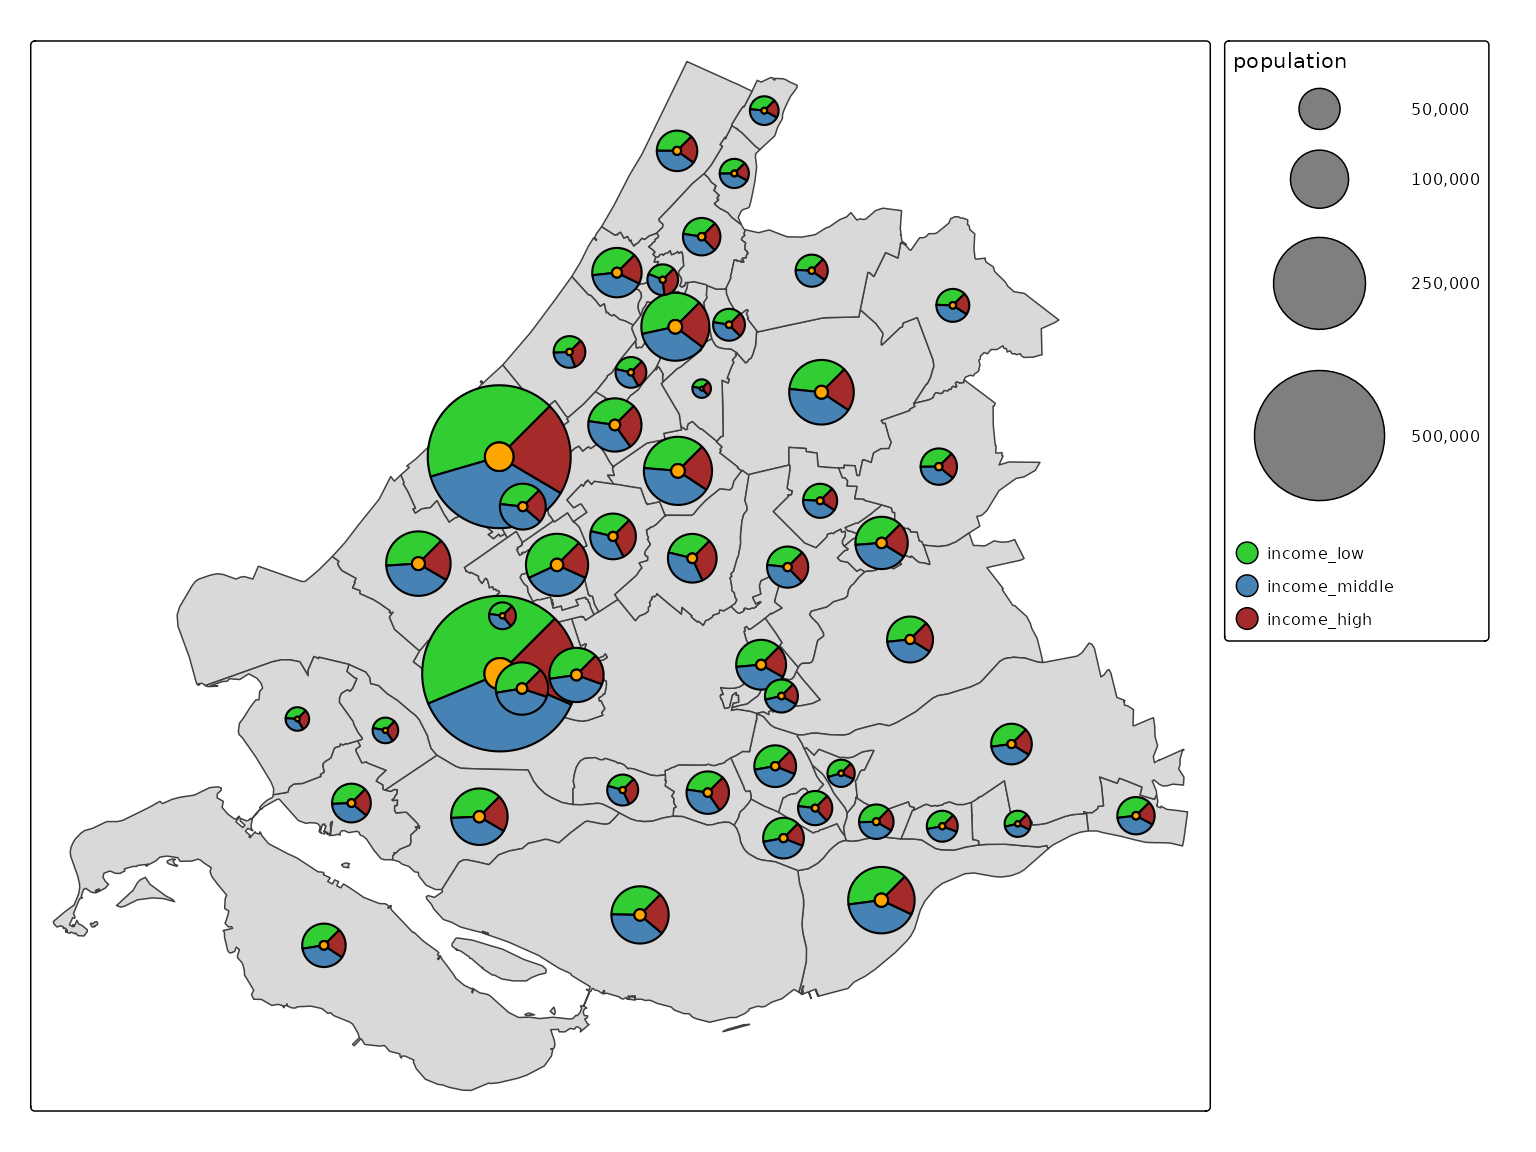
Explanation:
-
value.neutralis used for legends of other visual variables (in this case size). See vignette on neutral values - For each tmap layer,
optionsis used for option specific settings. The default list is obtained viaopt_tm_<layer>.