Scales in tmap are configured by the family of functions with prefix tm_scale.
Such function should be used for the input of the .scale arguments in the layer
functions (e.g. fill.scale in tm_polygons()).
The function tm_scale_continuous() is used for continuous data.
The functions tm_scale_continuous_<x>() use transformation functions x.
Usage
tm_scale_continuous(
  n = NULL,
  limits = NULL,
  outliers.trunc = NULL,
  ticks = NULL,
  trans = NULL,
  midpoint = NULL,
  values = NA,
  values.repeat = FALSE,
  values.range = NA,
  values.scale = NA,
  value.na = NA,
  value.null = NA,
  value.neutral = NA,
  labels = NULL,
  label.na = NA,
  label.null = NA,
  label.format = tm_label_format(),
  trans.args = list()
)

tm_scale_continuous_log(..., base = exp(1))

tm_scale_continuous_log2(...)

tm_scale_continuous_log10(...)

tm_scale_continuous_log1p(...)

tm_scale_continuous_sqrt(...)

tm_scale_continuous_pseudo_log(..., base = exp(1), sigma = 1)
Arguments
- n
Preferred number of tick labels. Only used if
ticksis not specified- limits
Limits of the data values that are mapped to the continuous scale. When
NA, the range of data values is taken. When only one value is provided, the range of data values with this provided value is taken. The default depends on the visual variable: it is 0 for all visual variables other than color whentm_scale_continuousis used. For the transformation scale functions, it isNA.- outliers.trunc
Should outliers be truncated? An outlier is a data value that is below or above the respectively lower and upper limit. A logical vector of two values is expected. The first and second value determines whether values lower than the lower limit respectively higher than the upper limit are truncated to the lower respectively upper limit. If
FALSE(default), they are considered as missing values.- ticks
Tick values. If not specified, it is determined automatically with
n- trans
Transformation function. One of
"identity"(default),"log", and"log1p". Note: the base of the log scale is irrelevant, since the log transformed values are normalized before mapping to visual values.- midpoint
The data value that is interpreted as the midpoint. By default it is set to 0 if negative and positive values are present. Useful when values are diverging colors. In that case, the two sides of the color palette are assigned to negative respectively positive values. If all values are positive or all values are negative, then the midpoint is set to
NA, which means that the value that corresponds to the middle color class (seestyle) is mapped to the middle color. If it is specified for sequential color palettes (e.g."Blues"), then this color palette will be treated as a diverging color palette.- values
(generic scale argument) The visual values. For colors (e.g.
fillorcolfortm_polygons()) this is a palette name from thecols4allpackage (seecols4all::c4a()) or vector of colors, for size (e.g.sizefortm_symbols()) these are a set of sizes (if two values are specified they are interpret as range), for symbol shapes (e.g.shapefortm_symbols()) these are a set of symbols, etc. The tmap optionvalues.varcontains the default values per visual variable and in some cases also per data type.- values.repeat
(generic scale argument) Should the values be repeated in case there are more categories?
- values.range
(generic scale argument) Range of the values, especially useful for color palettes. Vector of two numbers (both between 0 and 1) where the first determines the minimum and the second the maximum. Full range, which means that all values are used, is encoded as
c(0, 1). For instance, when a gray scale is used for color (from black to white),c(0,1)means that all colors are used,0.25, 0.75means that only colors from dark gray to light gray are used (more precisely"grey25"to"grey75"), and0, 0.5means that only colors are used from black to middle gray ("grey50"). When only one number is specified, this is interpreted as the second number (where the first is set to 0). Default values can be set via the tmap optionvalues.range.- values.scale
(generic scale argument) Scaling of the values. Only useful for size-related visual variables, such as
sizeoftm_symbols()andlwdoftm_lines().- value.na
(generic scale argument) Value used for missing values. See tmap option
"value.na"for defaults per visual variable.- value.null
(generic scale argument) Value used for NULL values. See tmap option
"value.null"for defaults per visual variable. Null data values occur when out-of-scope features are shown (e.g. for a map of Europe showing a data variable per country, the null values are applied to countries outside Europe).- value.neutral
(generic scale argument) Value that can be considered neutral. This is used for legends of other visual variables of the same map layer. E.g. when both
fillandsizeare used fortm_symbols()(using filled circles), the size legend items are filled with thevalue.neutralcolor from thefill.scalescale, and fill legend items are bubbles of sizevalue.neutralfrom thesize.scalescale.- labels
(generic scale argument) Labels
- label.na
(generic scale argument) Label for missing values
- label.null
(generic scale argument) Label for null (out-of-scope) values
- label.format
(generic scale argument) Label formatting. Output of
tm_label_format()- trans.args
list of additional argument for the transformation (generic transformation arguments)
- ...
passed on to
tm_scale_continuous()- base
base of logarithm
- sigma
Scaling factor for the linear part of pseudo-log transformation.
Examples
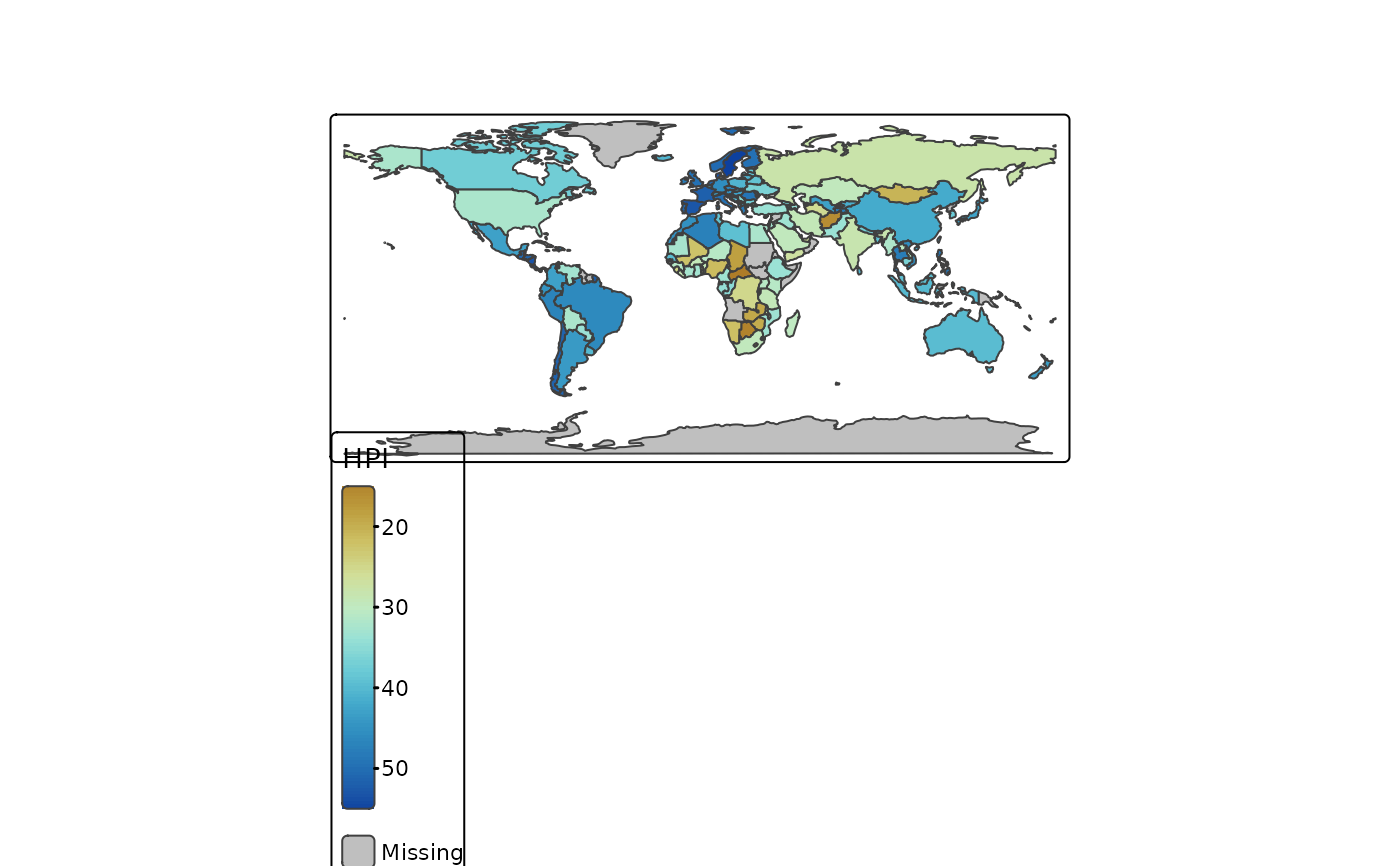
tm_shape(World) +
  tm_polygons(
    fill = "HPI",
    fill.scale = tm_scale_continuous(values = "scico.roma", midpoint = 30))


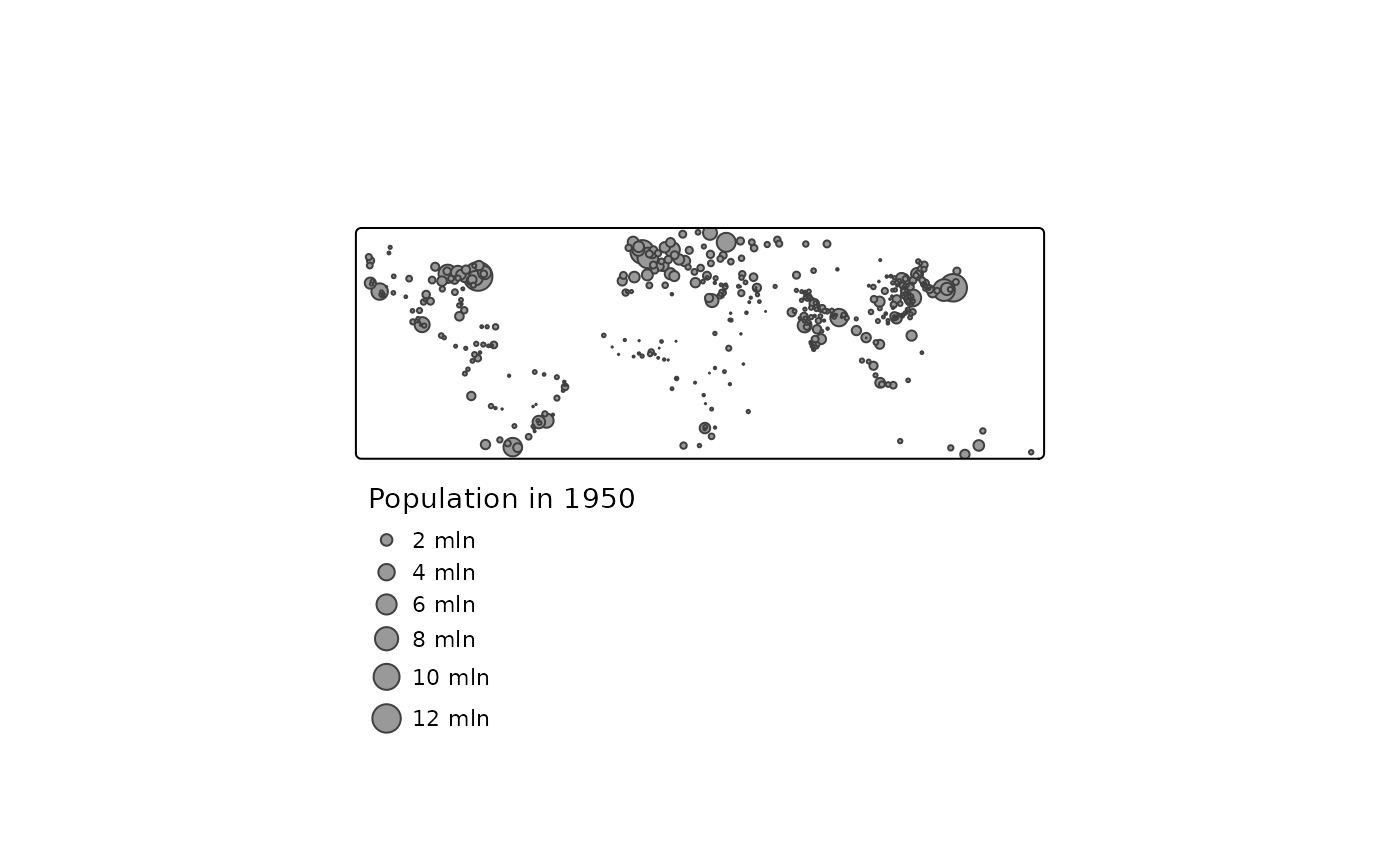
tm_shape(metro) +
  tm_bubbles(
    size = "pop1950",
    size.scale = tm_scale_continuous(
      values.scale = 1),
    size.legend = tm_legend("Population in 1950", frame = FALSE))


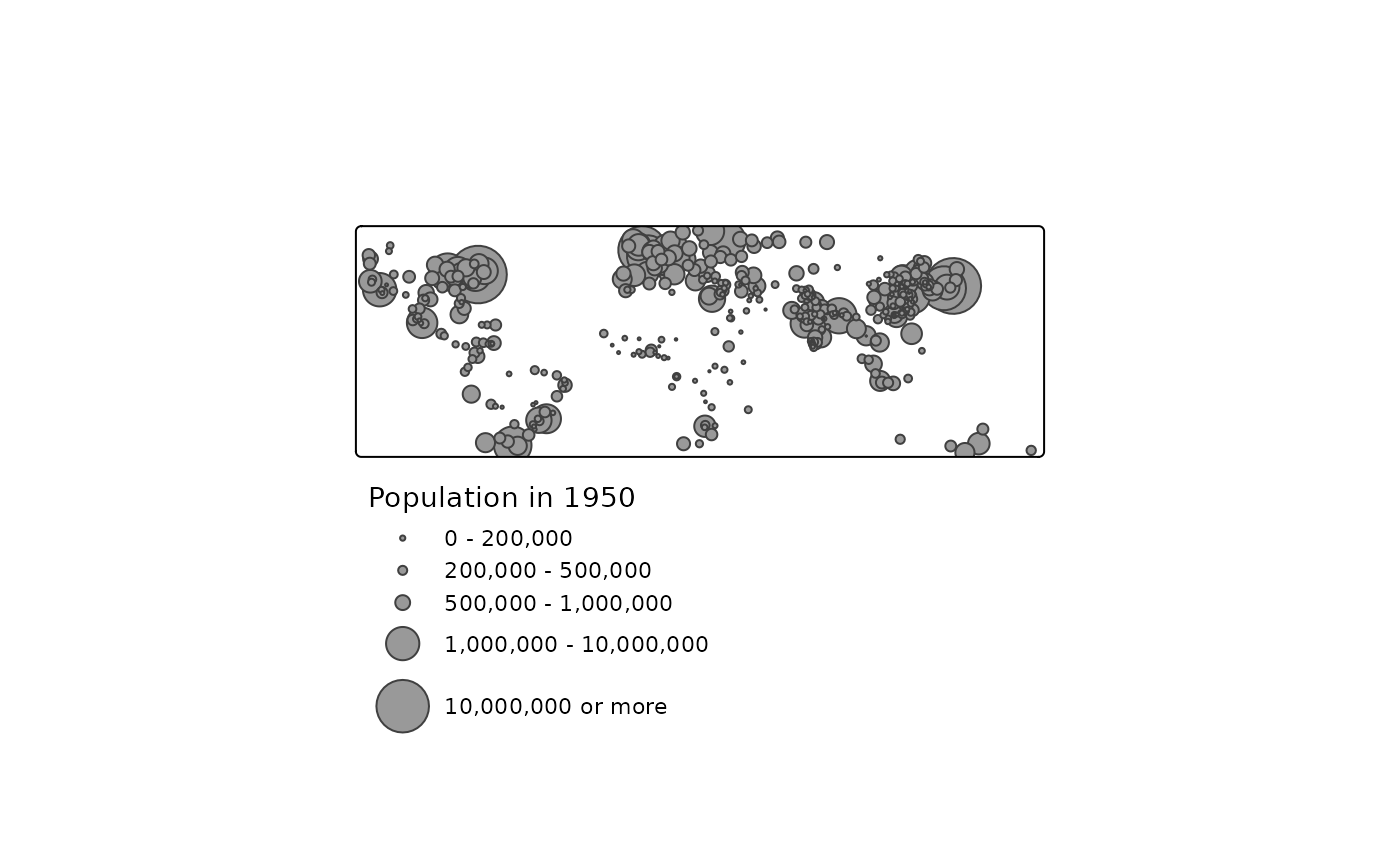
tm_shape(metro) +
  tm_bubbles(
    size = "pop1950",
    size.scale = tm_scale_continuous(
      values.scale = 2,
      limits = c(0, 12e6),
      ticks = c(1e5, 3e5, 8e5, 4e6, 1e7),
      labels = c("0 - 200,000", "200,000 - 500,000", "500,000 - 1,000,000",
        "1,000,000 - 10,000,000", "10,000,000 or more"),
      outliers.trunc = c(TRUE, TRUE)),
    size.legend = tm_legend("Population in 1950", frame = FALSE))

# Note that for this type of legend, we recommend tm_scale_intervals()
