Introduction
Integration of tmap with shiny is straightforward.
The functions tmapOutput() and renderTmap() are similar to shiny::plotOutput() and shiny::renderPlot(), respectively.
As an example, let’s create a shiny app where the user selects a variable for which a choropleth/categorical map is drawn. The selected set of variables is:
(world_vars = setdiff(names(World), c("iso_a3", "name", "sovereignt", "geometry")))
#>  [1] "continent"    "area"         "pop_est"      "pop_est_dens" "economy"
#>  [6] "income_grp"   "gdp_cap_est"  "life_exp"     "well_being"   "footprint"
#> [11] "HPI"          "inequality"   "gender"       "press"
Plot mode
We recommend to use zindex for each tmap layer (such as tm_polygons()) to make sure their positions remain fixed.

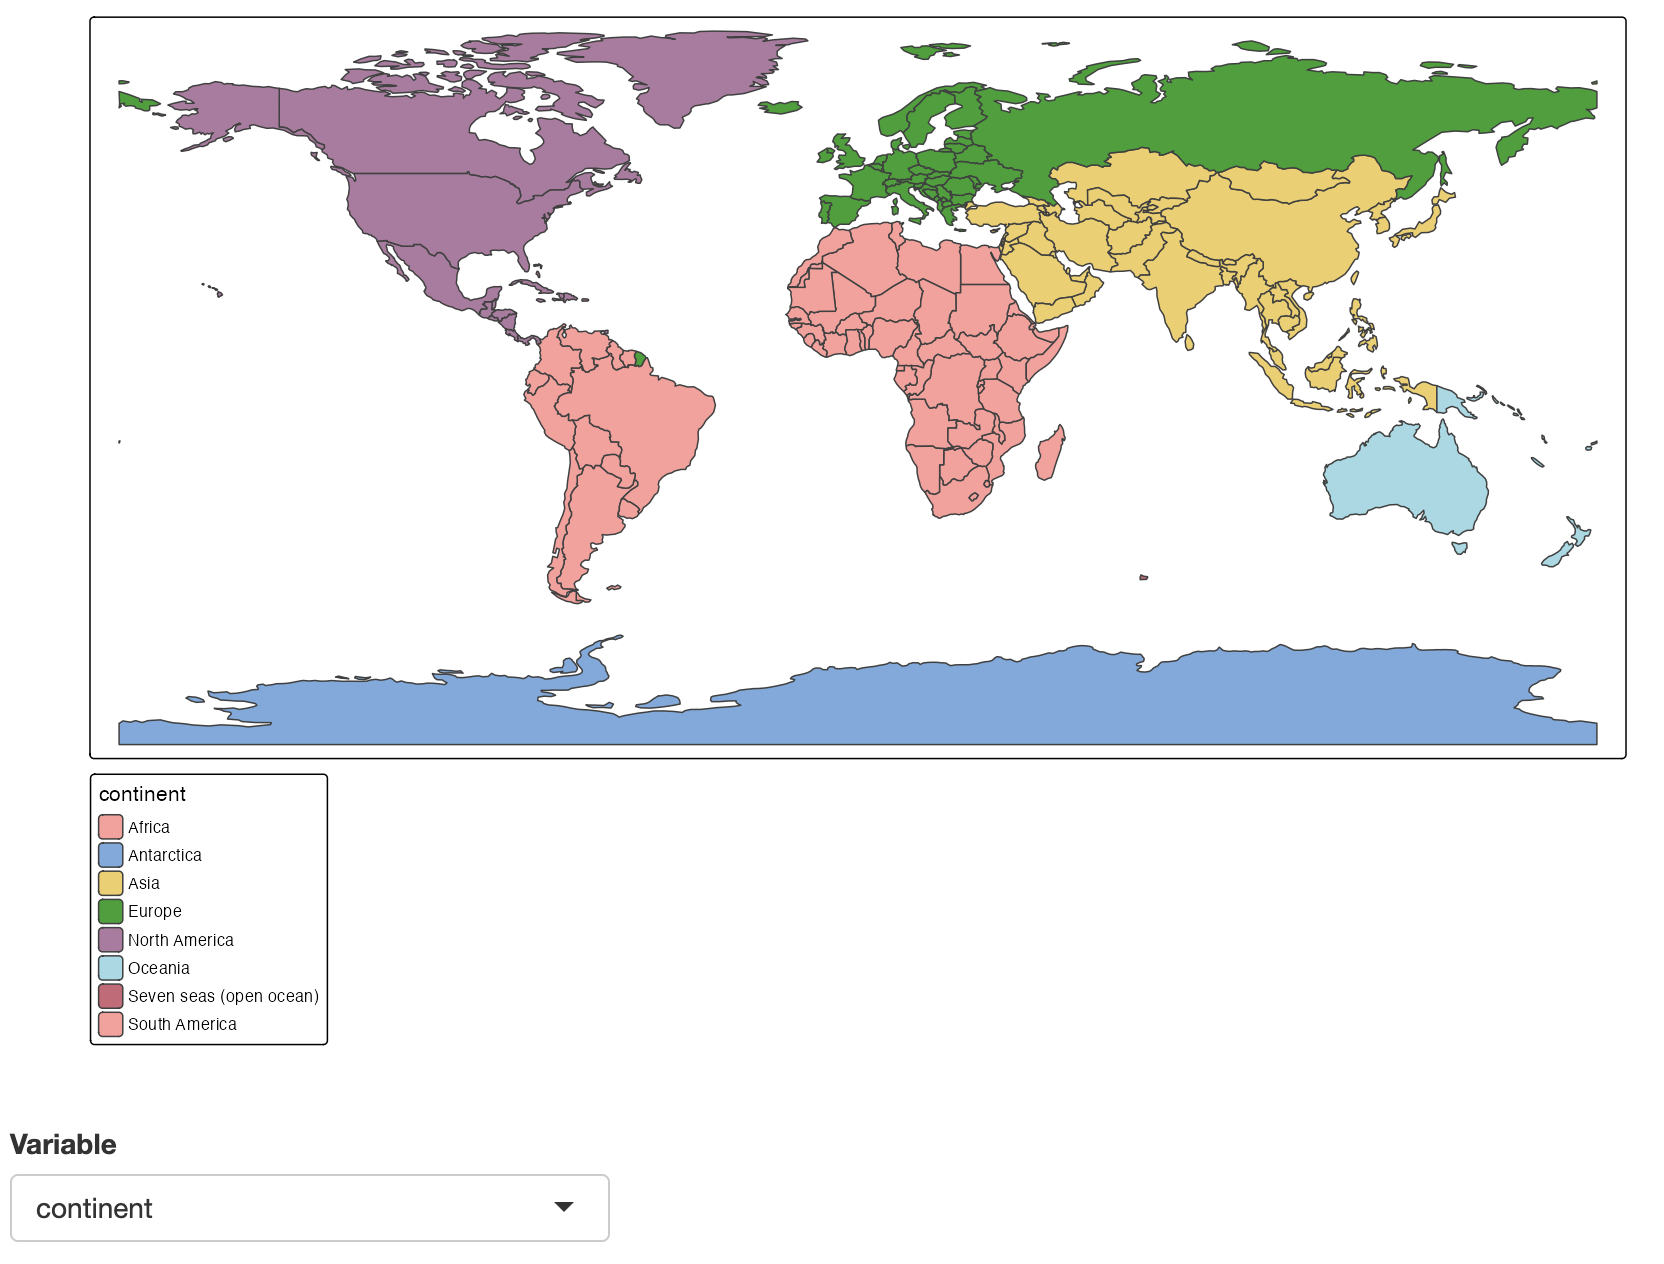
Figure 1: Shiny app with tmap in plot mode
tmap_mode("plot")

shinyApp(
    ui = fluidPage(
        tmapOutput("map", height = "600px"),
        selectInput("var", "Variable", world_vars)
    ),
    server <- function(input, output, session) {
        output$map <- renderTmap({
            tm_shape(World) +
                tm_polygons(input$var, zindex = 401)
        })
    }
)
View mode
For the view mode, we can additionally make the use of tmapProxy().
This enables users to update the map without a complete re-render; the zoom window also will not be reset.

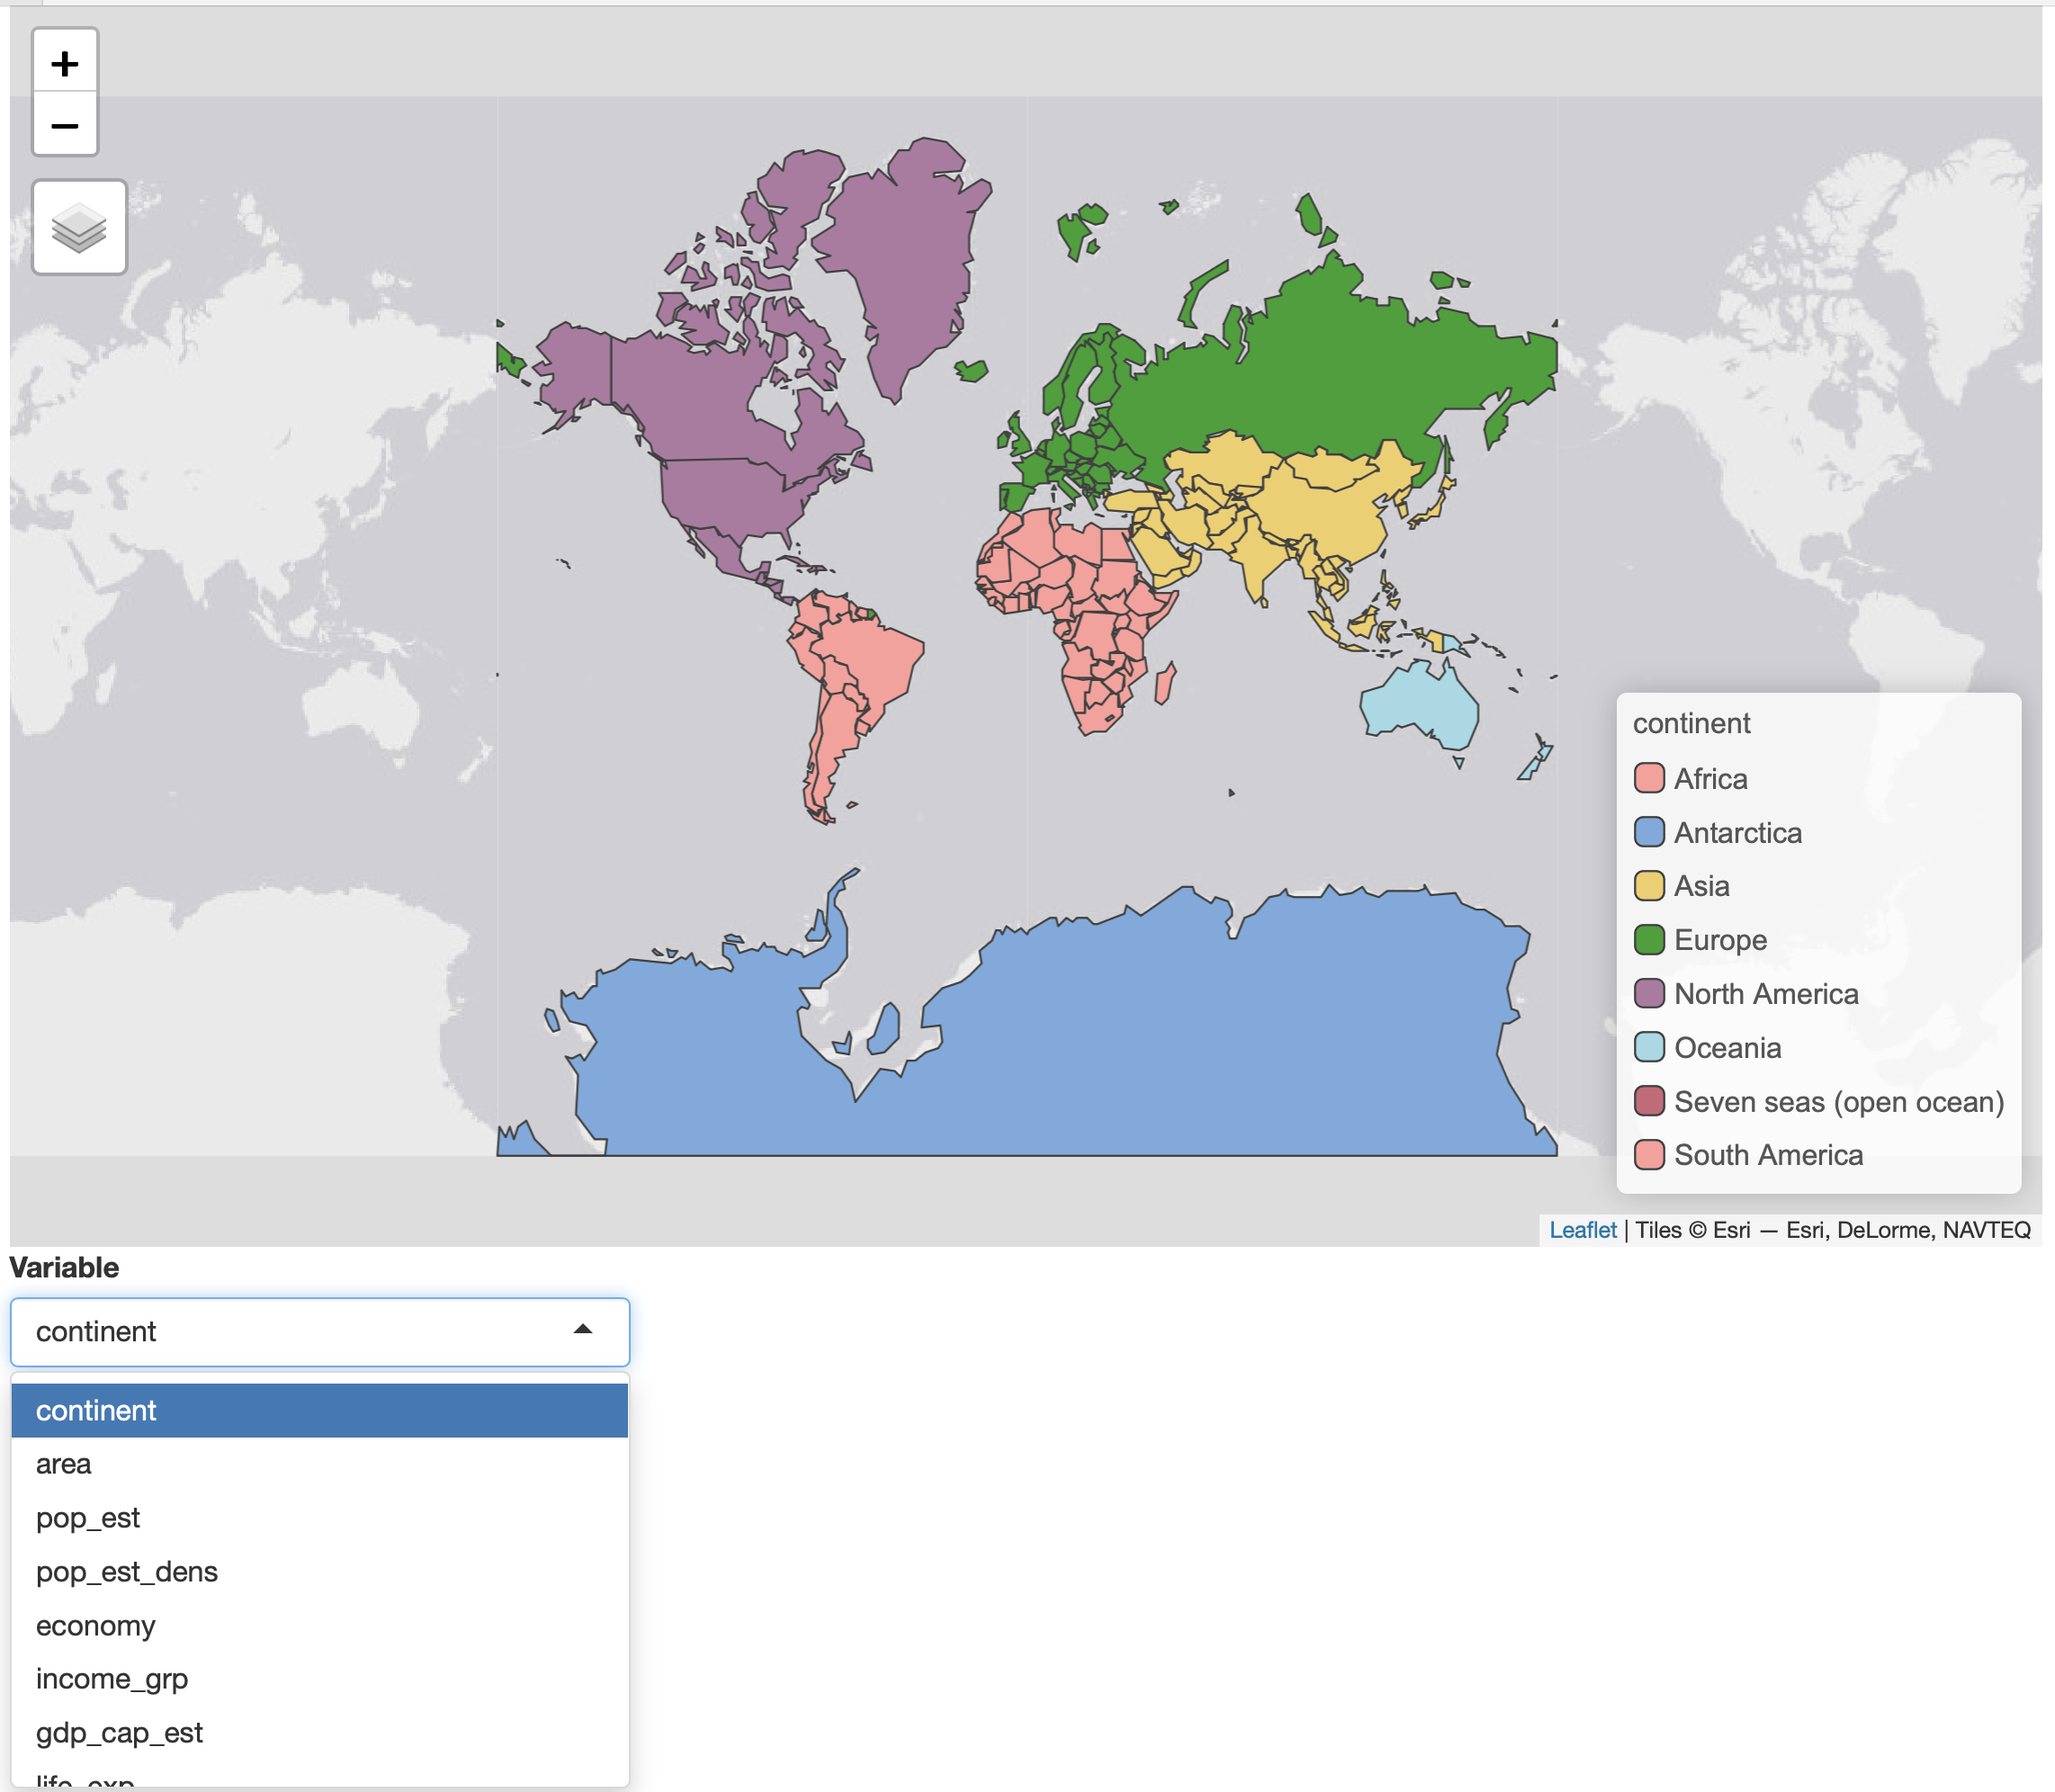
Figure 2: Shiny app with tmap in view mode
tmap_mode("view")

shinyApp(
    ui = fluidPage(
        tmapOutput("map", height = "600px"),
        selectInput("var", "Variable", world_vars)
    ),
    server <- function(input, output, session) {
        output$map <- renderTmap({
            tm_shape(World, id = "iso_a3") +
                tm_polygons(world_vars[1], zindex = 401)
        })
        observe({
            var <- input$var
            tmapProxy("map", session, {
                tm_remove_layer(401) +
                    tm_shape(World, id = "iso_a3") +
                    tm_polygons(var, zindex = 401)
            })
        })
    }, options = list(launch.browser=TRUE)
)