tmap_mode()gets (no argument) or sets the current mode.ttm()toggles between the two most recent modes.ttmp()same asttm(), then callstmap_last().rtm()rotates through all modes in the pool.rtmp()same asrtm(), then callstmap_last().tmap_mode_pool()restricts which modes are cycled byttm()andrtm(). Call without arguments to inspect the current pool, or passNULLto reset.
It is recommended to use tmap_mode() in scripts and ttm()/ttmp() in the console.
Usage
tmap_mode(mode = NULL, silent = FALSE)

ttm()

rtm()

tmap_mode_pool(modes = NULL, silent = FALSE)

ttmp()

rtmp()
Arguments
- mode
A string specifying the mode. See
tmap_options()for available modes.- silent
Should the mode be switched silently? Default
FALSE.- modes
Character vector of mode names (minimum 2), or
NULLto reset.
Value
tmap_mode()returns the current mode invisibly when called without argument, otherwise the previous mode.ttm(),rtm()return the previous mode invisibly.tmap_mode_pool()returns the previous pool invisibly.
Details
The default modes are "plot" (static, graphics device) and "view" (interactive,
browser or RStudio Viewer). Additional modes such as "maplibre" and "mapbox" become
available when tmap.mapgl is loaded.
References
Tennekes, M., 2018, tmap: Thematic Maps in R, Journal of Statistical Software, 84(6), 1-39, doi:10.18637/jss.v084.i06
See also
.doc_see_also_modes()
tmap_last()to show the last maptm_view()for viewing optionstmap_leaflet()for obtaining a leaflet widgettmap_options()for tmap options
Examples
current.mode = tmap_mode()
#> ℹ tmap modes "plot" - "view"
#> ℹ toggle with `tmap::ttm()`
#> This message is displayed once per session.
tmap_mode("plot")
#> ℹ tmap modes "plot" - "view"
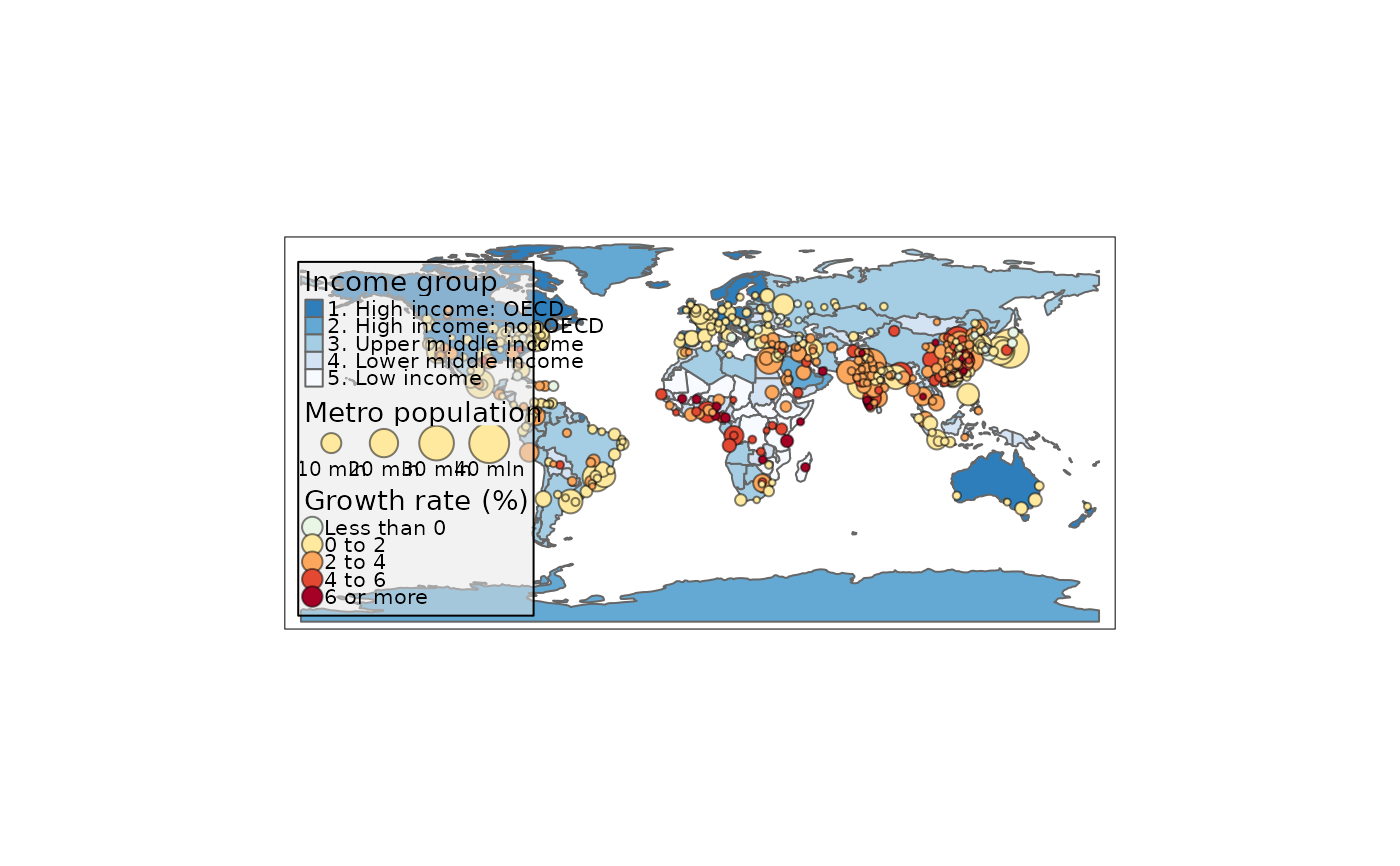
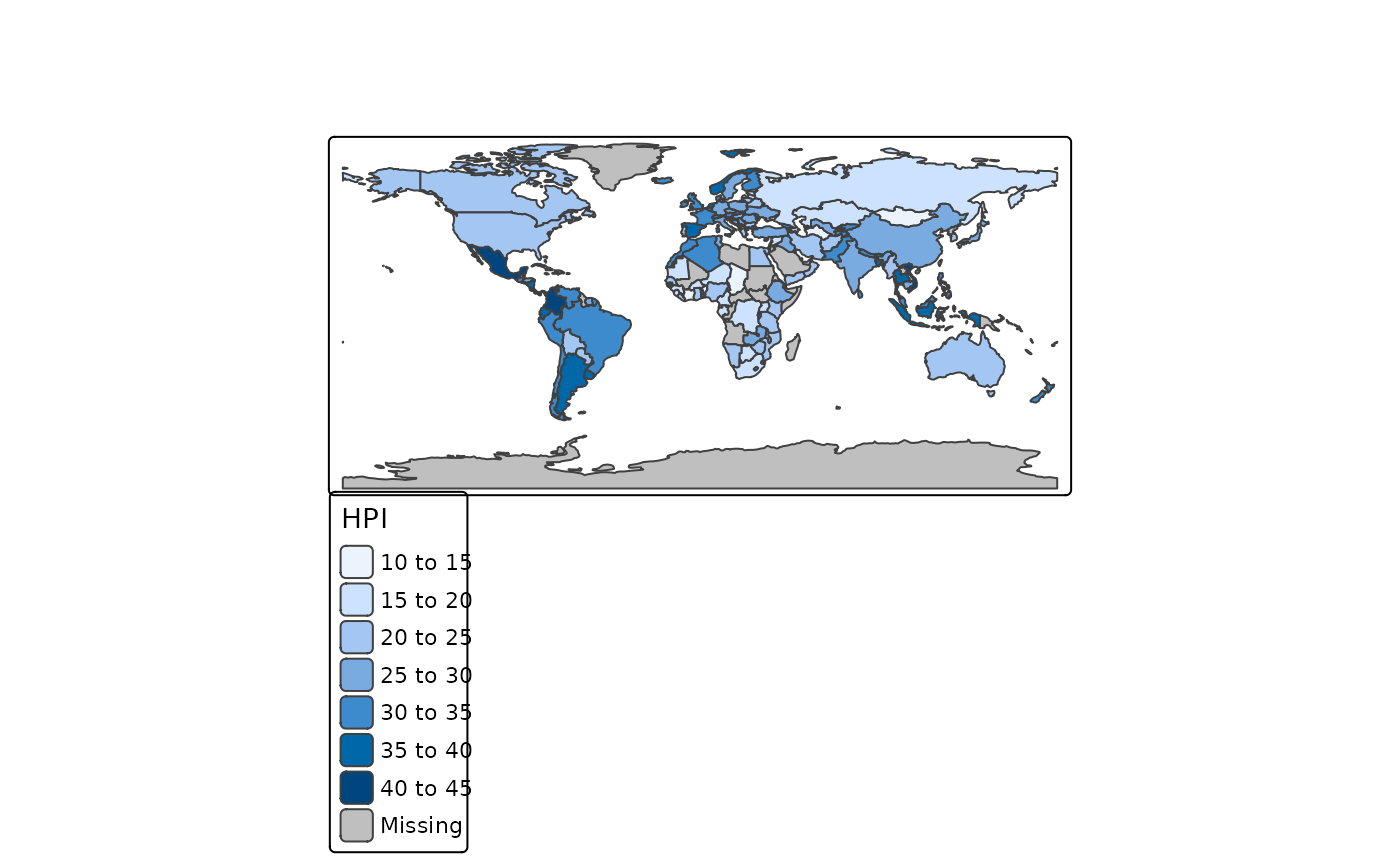
tm_shape(World) + tm_polygons("HPI")
 tmap_mode("view")
#> ℹ tmap modes "plot" - "view"
tm_shape(World) + tm_polygons("HPI")
ttm()
#> ℹ tmap modes "plot" - "view"
tm_shape(World) + tm_polygons("HPI")
tmap_mode("view")
#> ℹ tmap modes "plot" - "view"
tm_shape(World) + tm_polygons("HPI")
ttm()
#> ℹ tmap modes "plot" - "view"
tm_shape(World) + tm_polygons("HPI")
 tmap_mode(current.mode)
#> ℹ tmap modes "plot" - "view"
tmap_mode(current.mode)
#> ℹ tmap modes "plot" - "view"