The Grammar of Graphics [1] is a framework for building statistical graphics by combining key components like data, aesthetic mappings, geometric objects, scales, transformations, and statistical summaries. It provides a systematic, modular approach to creating flexible and consistent visualizations.
Components:
- Data: The dataset being visualized.
- Aesthetic Mappings: How data maps to visual properties (e.g., position, color, size).
- Geometric Objects: Shapes representing the data (e.g., points, lines, bars).
- Scales: Rules linking data values to aesthetic values.
- Transformations: Adjustments to data or coordinates (e.g., log scales).
- Statistical Summaries: Computed data representations (e.g., means, trends).
- Facets: Layouts for splitting data into subsets for comparison.
It is applied in ggplot2 [2] and also in tmap, but slightly differently. What the Grammar of Graphics and ggplot2 call aesthetics, tmap calls map variables. Both refer to the visual properties (such as fill color, size, and line width) to which data values are mapped.
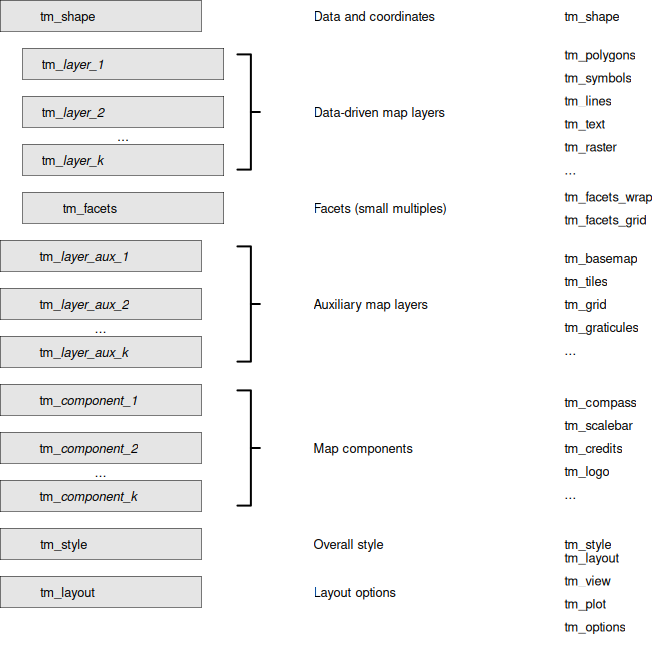
ggplot2
- In ggplot2, aesthetics are defined on the plot level (by default), but in tmap map variables are defined on the layer level. This makes sense, since in non-spatial visualizations the x and y aesthetics, the most important ones, are shared among the plot layers. However, in spatial visualizations the x and y coordinates are not considered data-driven but rather geometry-driven. The remaining map variables, such as fill and border color, line width, and symbol shape, naturally belong to individual layers.
- This also applies to scales: e.g. in ggplot2,
scale_fill_continuous()applies to the fill aesthetic for the whole plot. In tmap, scale functions are specified per map variable per layer:tm_polygons(fill = "my_var", fill.scale = tm_scale_continuous())
See other vignette (to do: link) that compares tmap with ggplot2 by a series of examples
[1]
Leland. Wilkinson and G. Wills, The grammar of graphics, 2nd ed. in Statistics and computing. New York: Springer, 2005.
[2]
H. Wickham, ggplot2: Elegant graphics for data analysis. Springer-Verlag New York, 2016. Available: https://ggplot2.tidyverse.org