Introduction
An inset map or minimap is a small map embedded in the main map. The
purpose of such a small map is 1) to show geographic context (zoomed
out) or 2) to show details (zoomed in). The first type is called a
minimap, created via tm_minimap. The second type can be
created with the general purpose function tm_inset().
So
- we use
tm_minimap(()to show a broader geographic context; where on earth is the main map located? - we use
tm_inset()to zoom in on areas that are too cluttered at the main maps’s scale.
Note that both tm_inset() and tm_minimap()
are map components (see vignette)
Minimaps
tmap_mode("plot")
#> ℹ tmap modes "plot" - "view"
#> ℹ toggle with `tmap::ttm()`
tm_shape(NLD_muni) +
    tm_polygons(
        fill = "edu_appl_sci") +
    tm_title("Population share with (applied) university degree in 2022") +
    tm_credits("Statistics Netherlands (CBS)") +
    tm_minimap(position = c("left", "top"))
#> [tip] Consider a suitable map projection, e.g. by adding `+ tm_crs("auto")`.
#> Linking to GEOS 3.12.1, GDAL 3.8.4, PROJ 9.4.0; sf_use_s2() is FALSE
#>
#> This message is displayed once per session.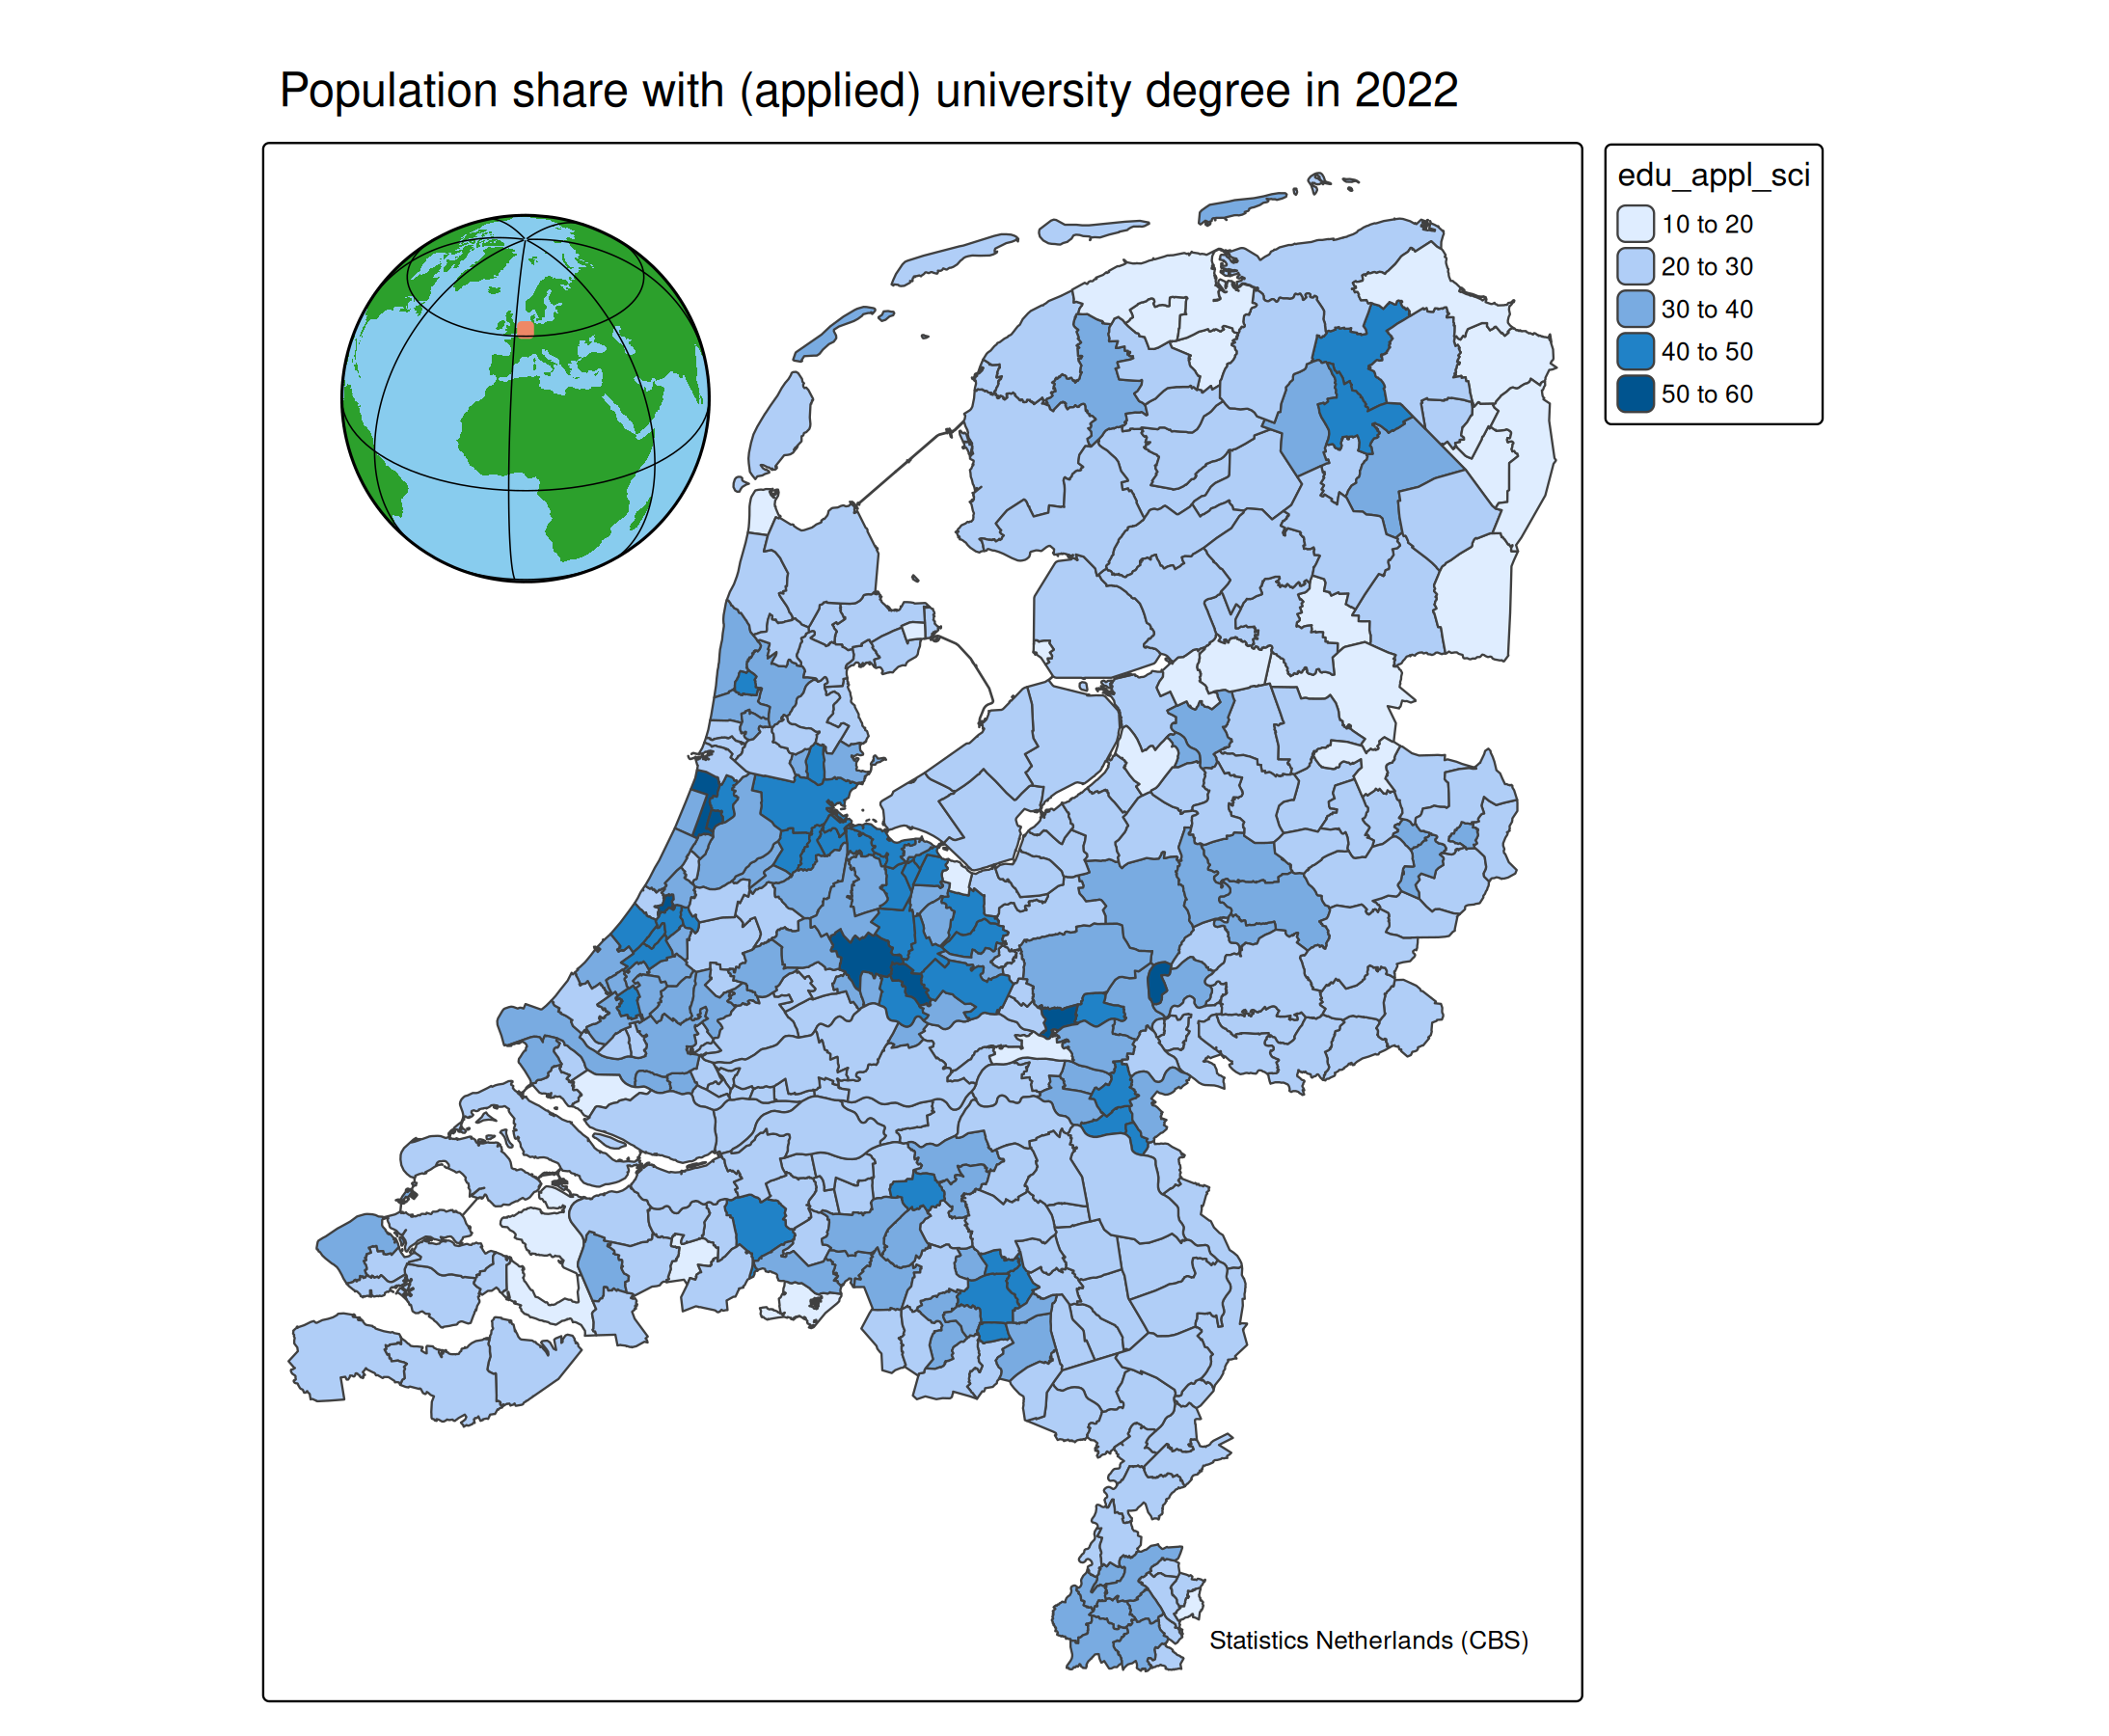
The implementation in plot mode is experimental (and new as of tmap 4.2). It features a small globe. There are no options implemented yet to change the appearance. Note that it takes a few seconds to run due to the applied orthographic map projection.
The minimap is interactive in view mode.
Note that the minimap is also supported in two other modes,
"maplibre" and "mapbox" via the extension
package tmap.mapgl.
Inset maps
Inset (zoomed in) maps are only implemented in "plot"
mode, because this feature is less usefull in interactive modes
("view", "maplibre" and "mapbox")
because of the user’s ability to zoom in.
The function tm_inset() is general purpose. It can
accept many input objects including ggplot2 objects and image files. In
this vignette, we look at two types of inputs: a bounding box and a tmap
object.
The same map zoomed in
When a bounding box is provided, the same map is plotted, but using the provided bounding box. This bounding box is usually smaller than the bounding box of the main map in order to zoom in on a region of interest.
The bounding box of the inset map can be a bbox object
created with sf::st_bbox() or tmaptools::bb().
The latter can also be used to query Open Street Map; if a character is
provided, it will use tmaptools::geocode_OSM to look for
the corresponding bounding box.
library(tmaptools)

tmap_mode("plot")
#> ℹ tmap modes "plot" - "view"
tm_shape(NLD_dist) +
    tm_polygons(
        fill = "edu_appl_sci",
        col = NULL) +
tm_shape(NLD_muni) +
    tm_borders() +
tm_title("Population share with (applied) university degree in 2022") +
tm_credits("Statistics Netherlands (CBS)") +
tm_title("Amsterdam", size = 0.8, position = c("left", "top")) +
tm_inset(bb("Amsterdam"), position = c("left", "top"), box_frame.color = "red", main_frame.color = "red") +
tm_title("The Hague", size = 0.8, position = c("left", "top")) +
tm_inset(bb("The Hague"), position = c("left", "top"), box_frame.color = "purple", main_frame.color = "purple") +
tm_layout(inner.margins = c(0.05, 0.2, 0.05, 0.05))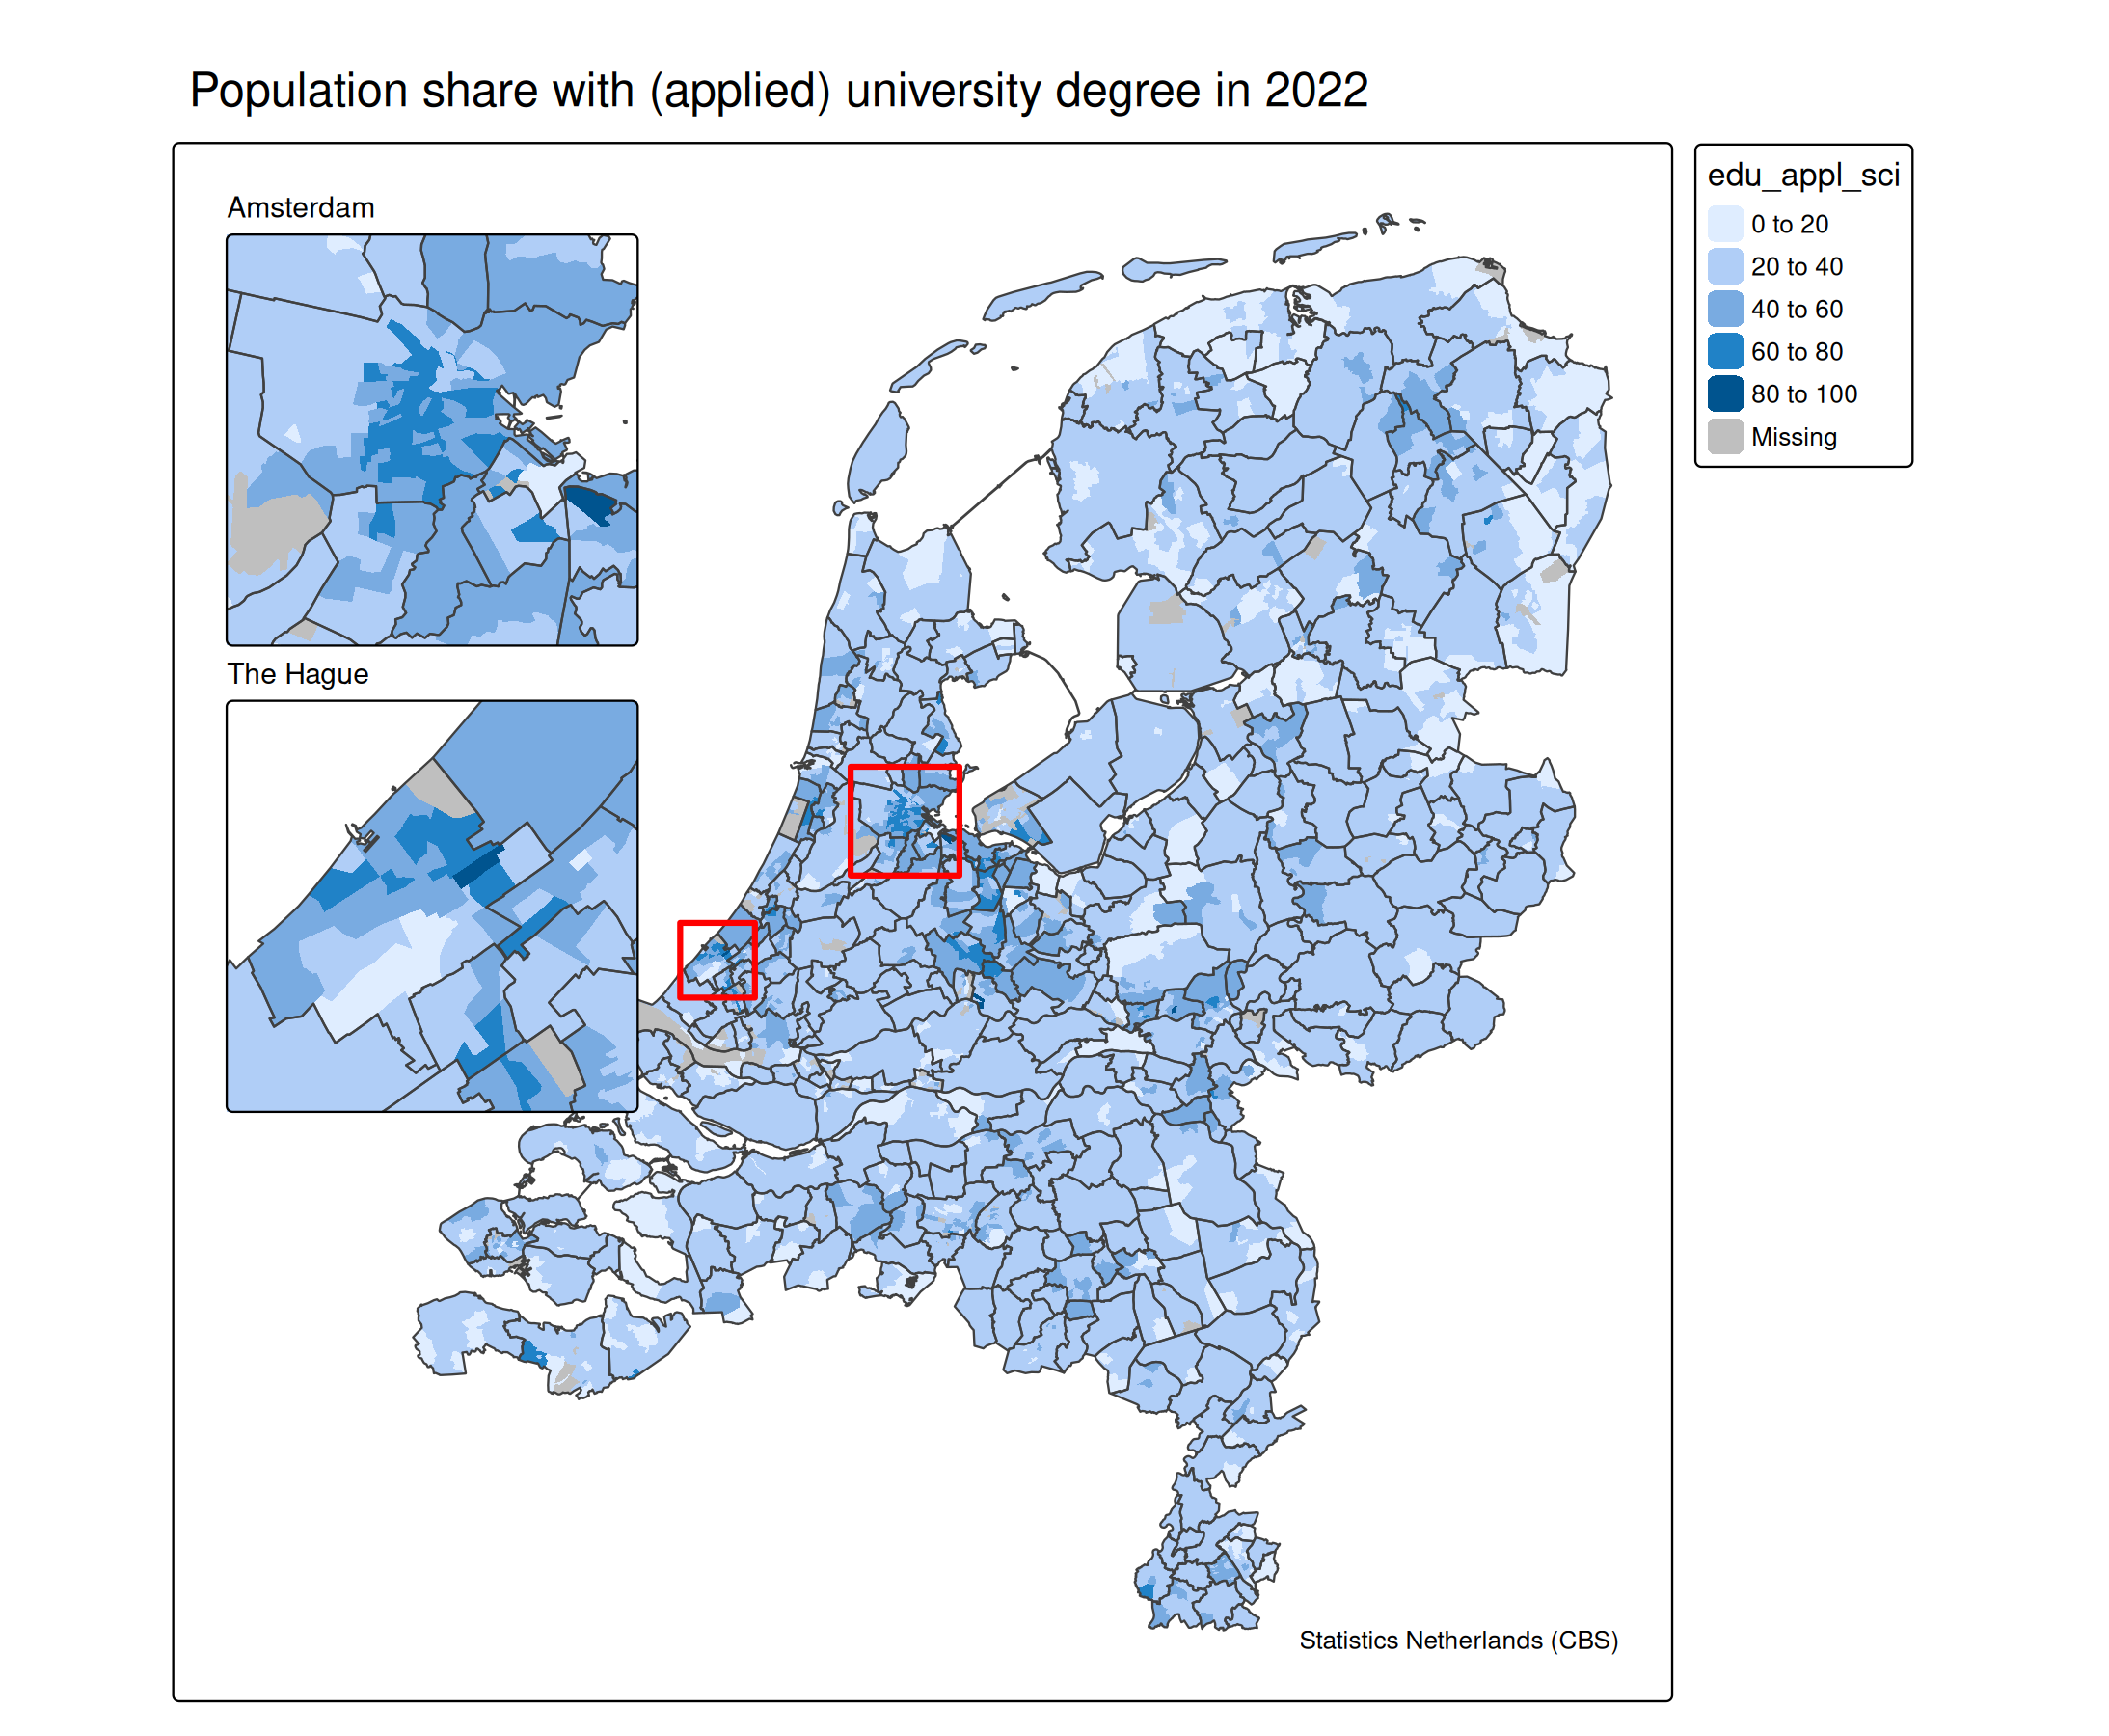
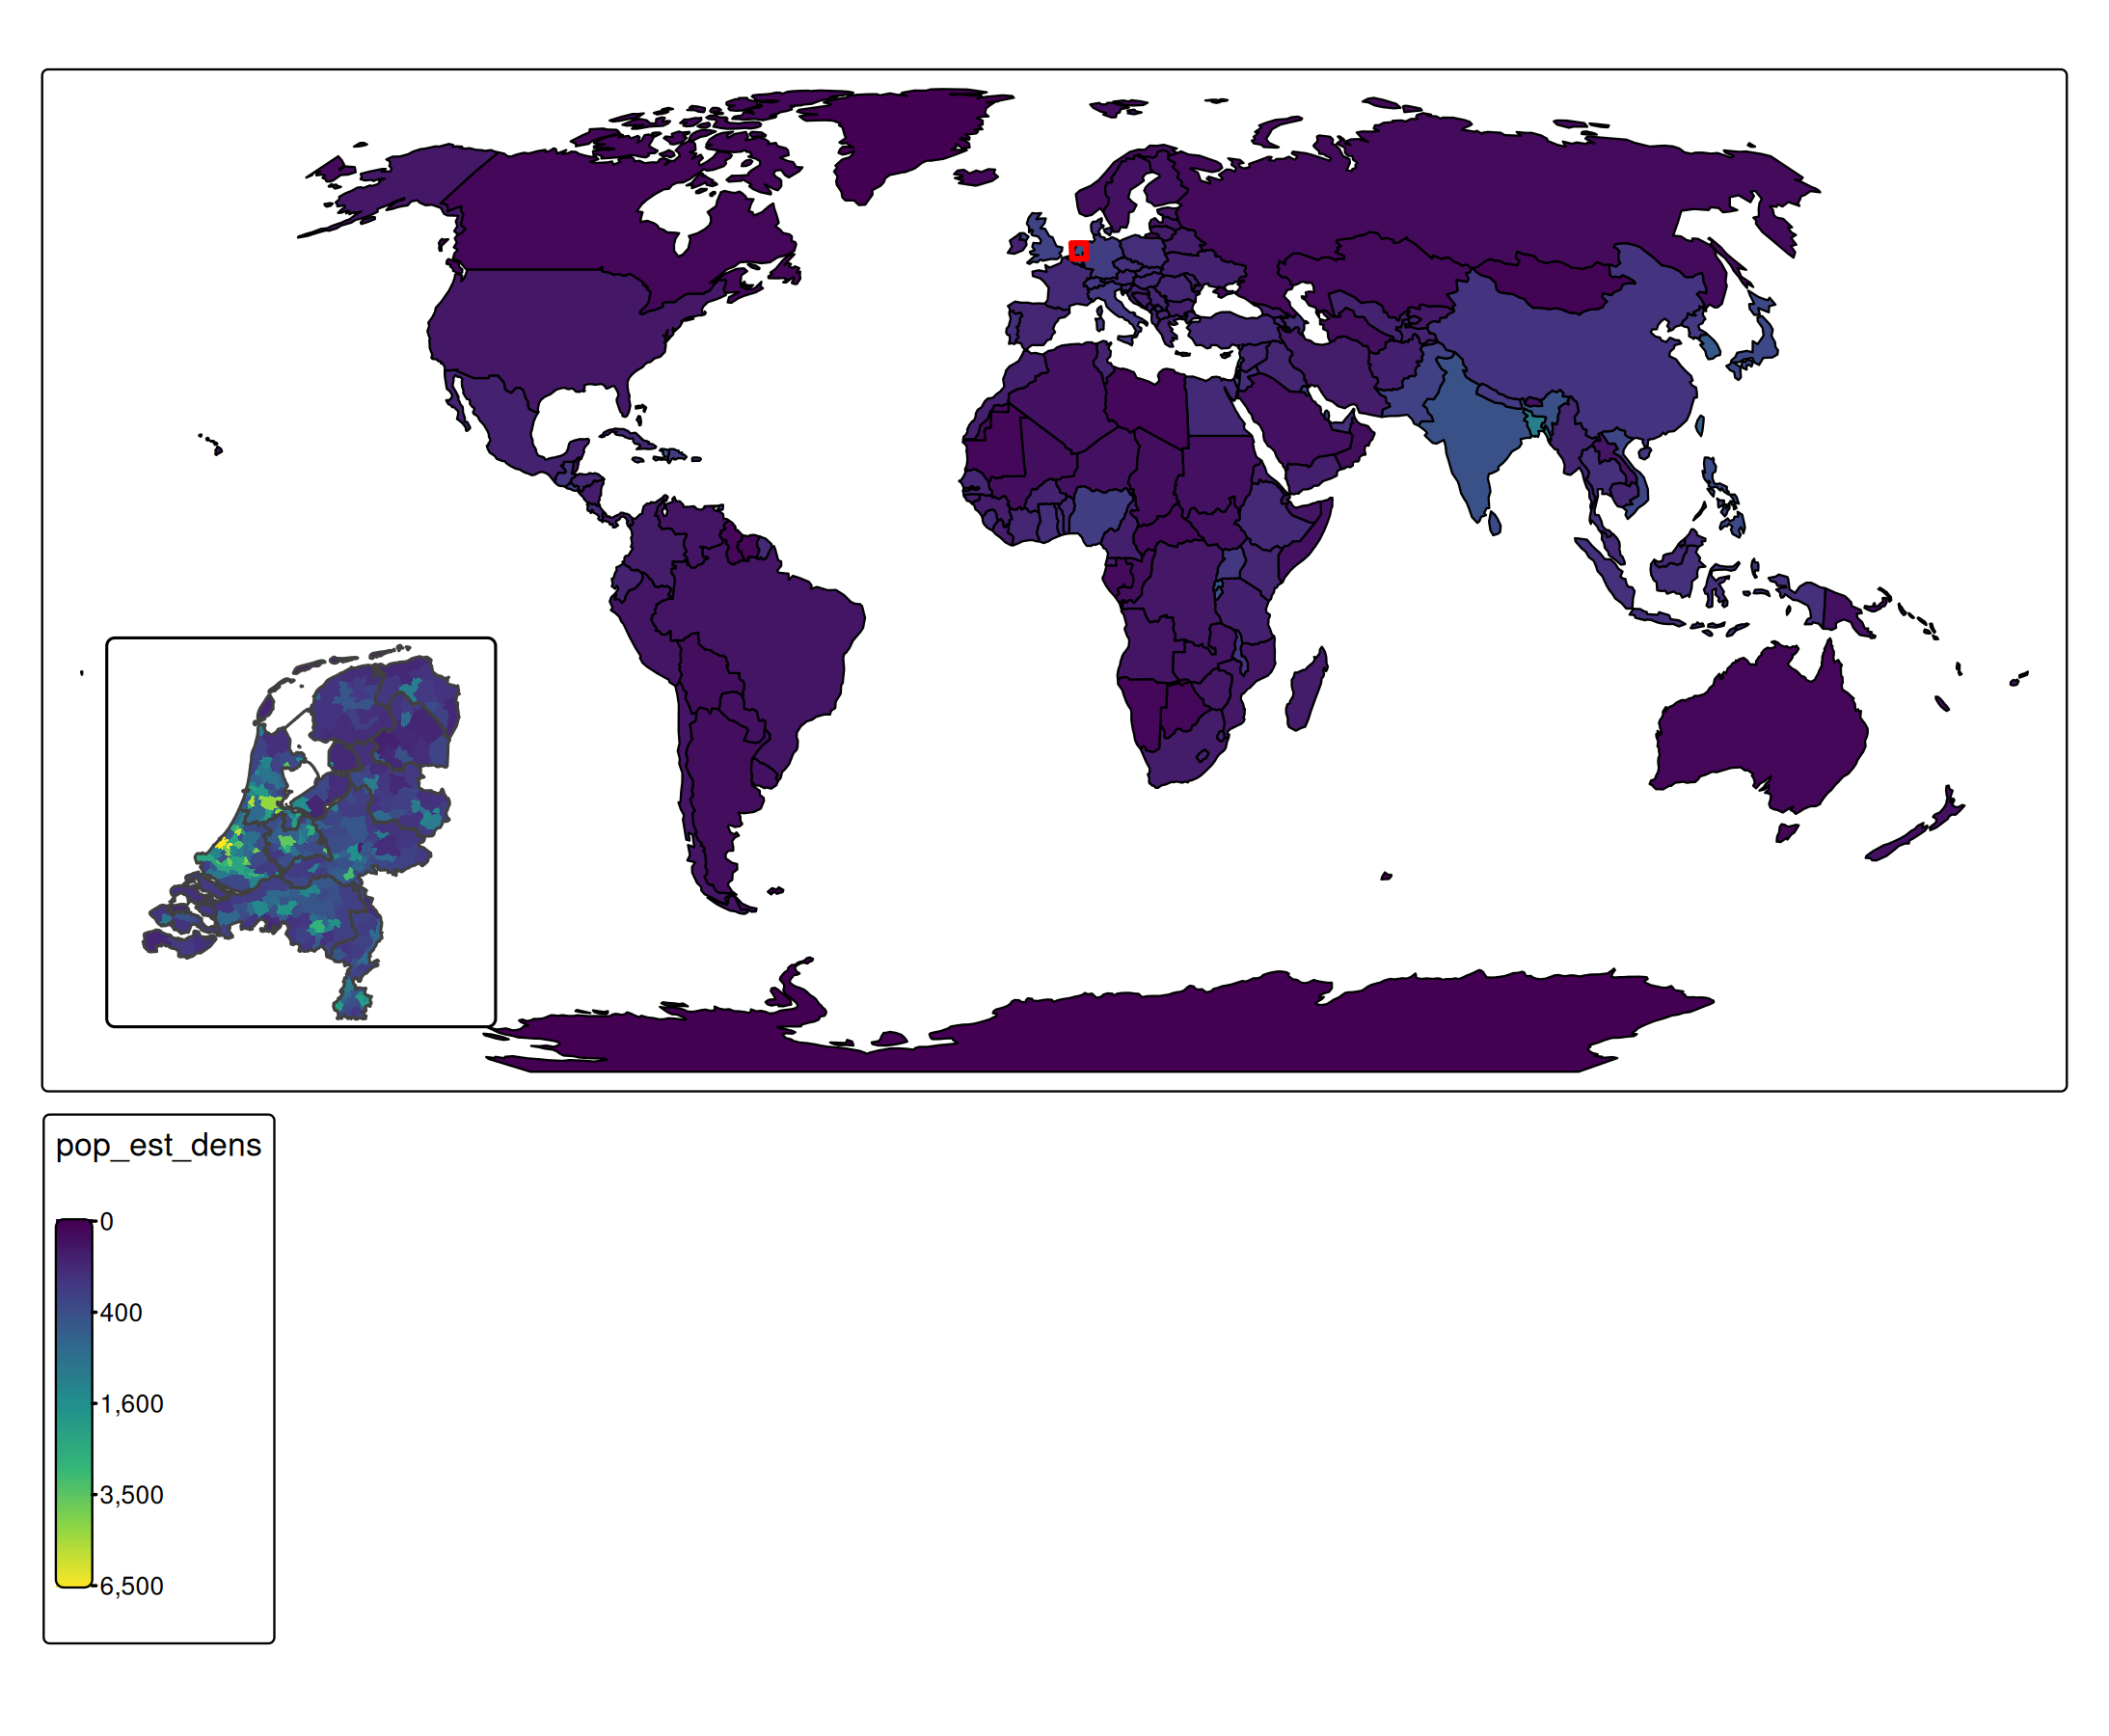
Custom inset maps
To have more flexibility it is also possible to inset a different tmap object.
NLD_muni$pop_est_dens = NLD_muni$population / NLD_muni$area

tm_NLD = tm_shape(NLD_muni) +
    tm_polygons(fill = "pop_est_dens",
                fill.legend = tm_legend_hide(),
                fill.scale = tm_scale_continuous_sqrt(values = "viridis", limits = c(0, 6500)),
                col = NULL) +
    tm_shape(NLD_prov) +
    tm_borders()

tm_shape(World) +
    tm_polygons(fill = "pop_est_dens",
                col = "black",
                fill.scale = tm_scale_continuous_sqrt(values = "viridis", limits = c(0, 6500))) +
    tm_inset(tm_NLD, position = c("left", "bottom")) +
    tm_crs("+proj=robin")