Modes
tmap facilitates two output modes:
-
"plot", which produces static maps, and -
"view"which produces (using the same tmap code) interactive maps (using the JavaScript library Leaflet as backend).
Via the extension package, tmap.mapgl, two interactive
new modes are available, "mapbox" and
"maplibre", as demonstrated below.
The default mode is "plot":
## current mode
tmap_mode()
#> ℹ tmap modes "plot" - "view"
#> ℹ toggle with `tmap::ttm()`Switching between modes
## to view mode
tmap_mode("view")
#> ℹ tmap modes "plot" - "view"
## back to plot mode
tmap_mode("plot")
#> ℹ tmap modes "plot" - "view"The handy function ttm() is used to toggle between the
modes:
## to view mode
ttm()
#> ℹ tmap modes "plot" - "view"
## back to plot mode
ttm()
#> ℹ tmap modes "plot" - "view"When more than two modes are loaded, rtm() can be used
to rotate between modes (see [below(https://r-tmap.github.io/tmap/articles/basics_modes#modes-mapbox-and-maplibre-)]).
Mode "plot"
We start with creating the plot and assign it to a variable called
tm.
tm = tm_shape(World, crs = 8857) +
tm_polygons(
fill = "press",
fill.scale = tm_scale_intervals(values = "pu_gn")) +
tm_shape(metro) +
tm_bubbles(
size = "pop2020",
fill = "gold",
size.scale = tm_scale_continuous(values.scale = 0.8, n = 8))We are in "plot" mode. Now we can plot the map by
printing the tm object:
tm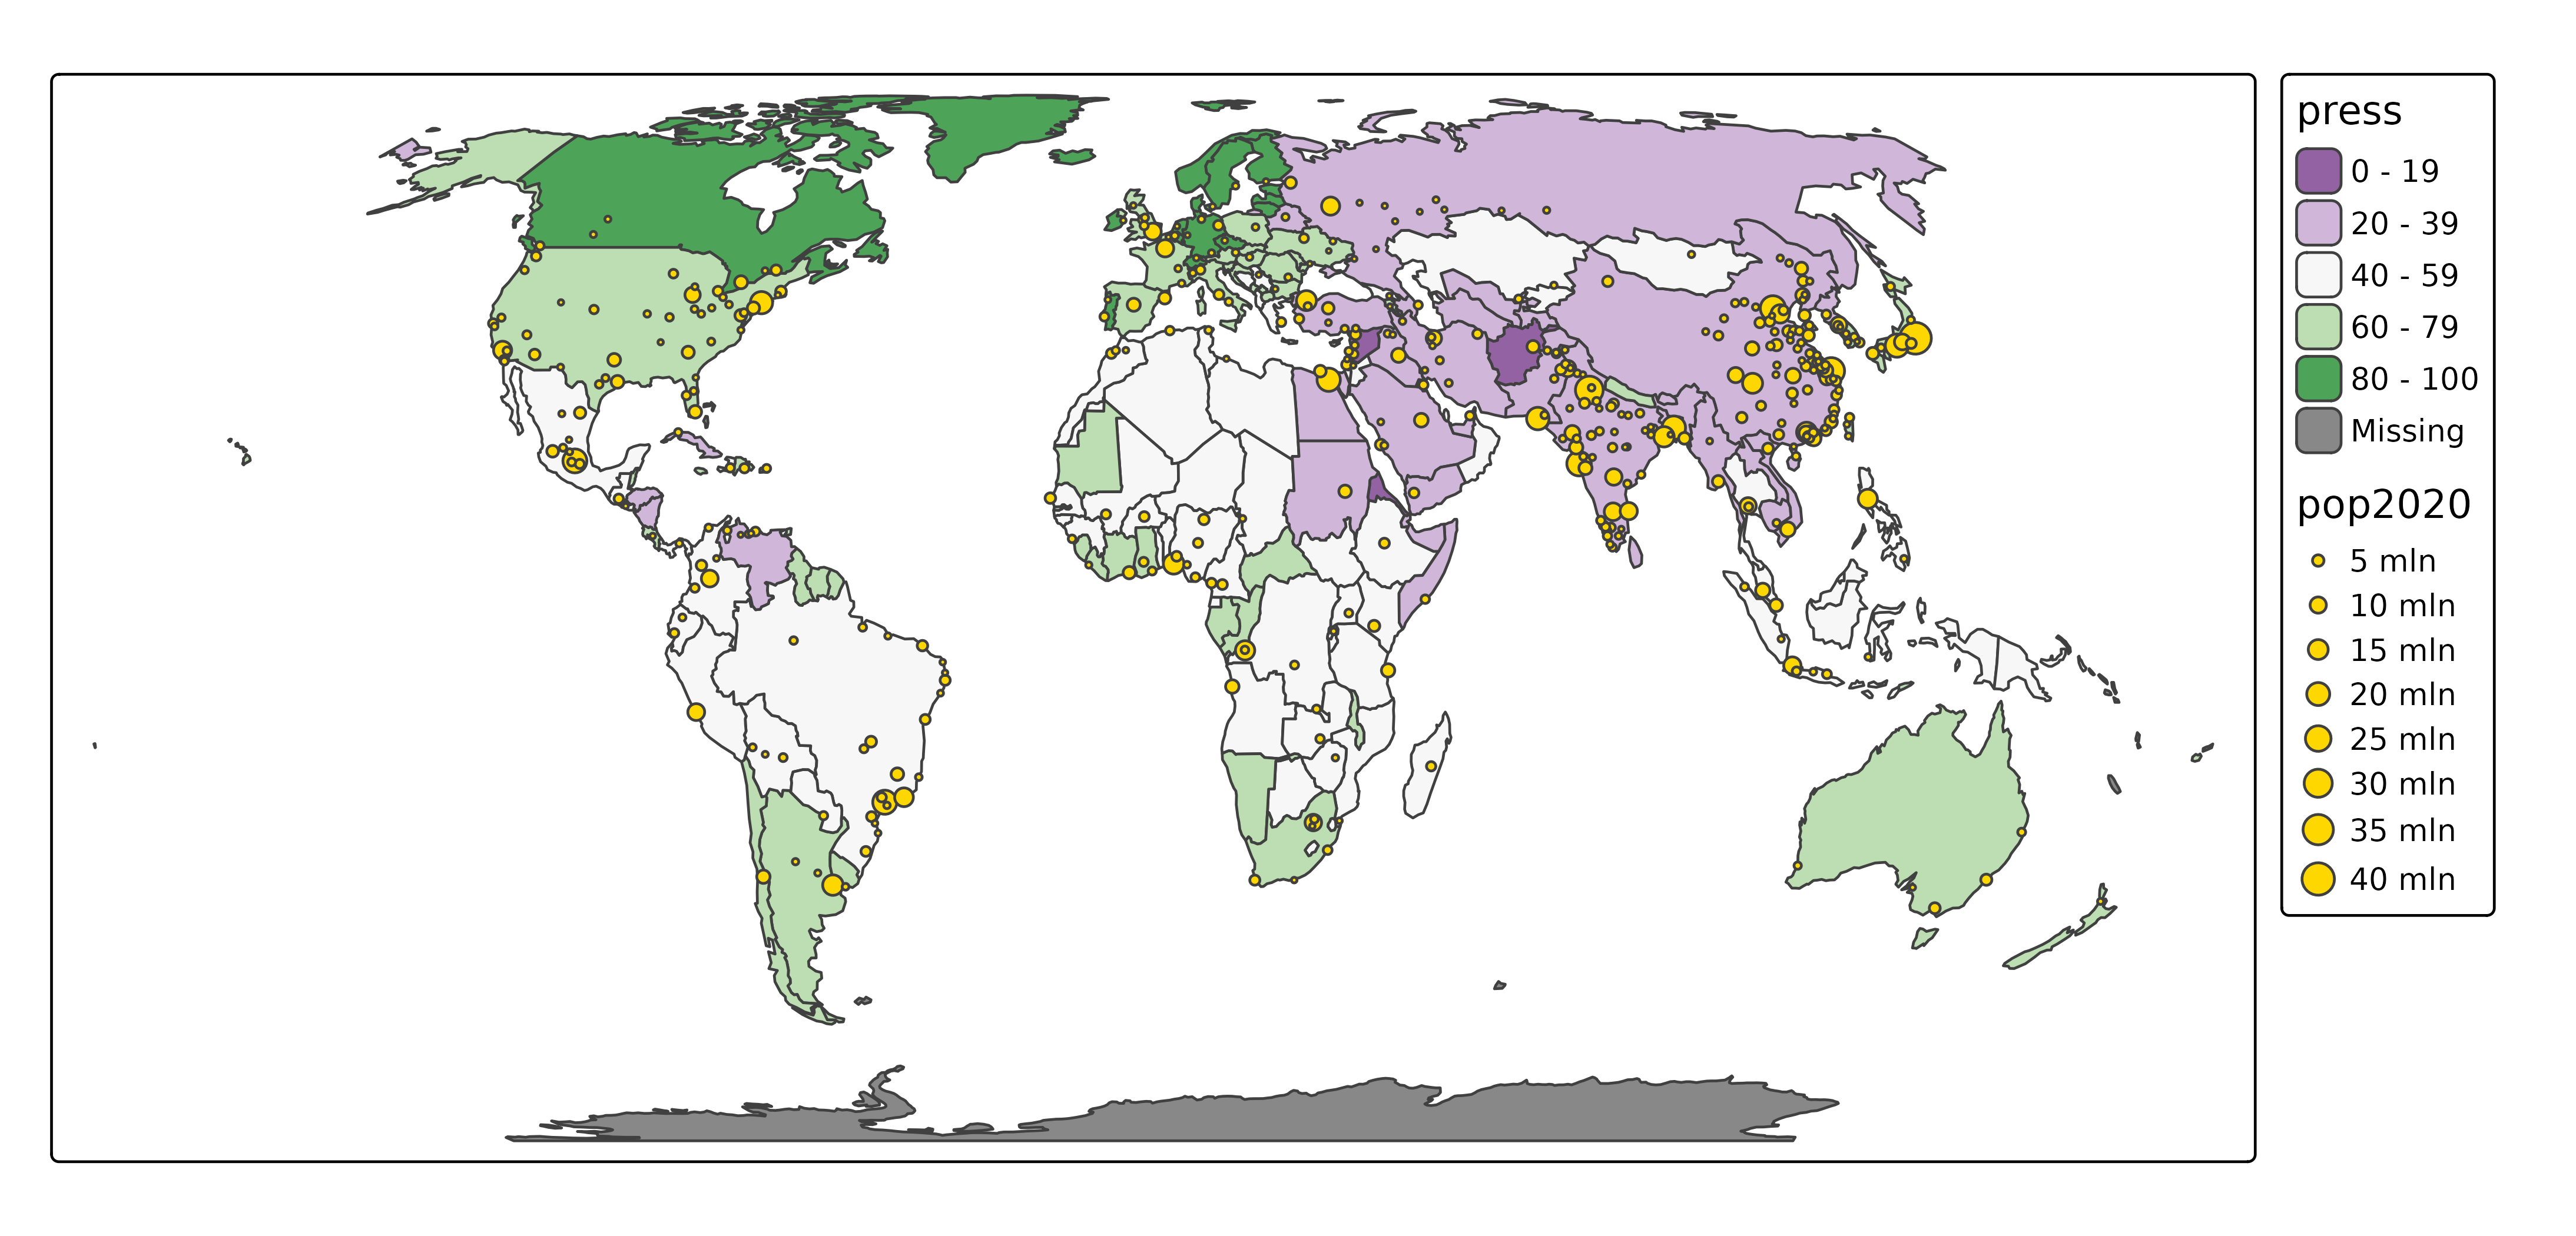
Mode "view"
The same map in view mode:
ttm()
#> ℹ tmap modes "plot" - "view"
tmNote that there is a big difference: in "view" mode
there are basemaps, and in "plot" mode none. This is caused
by different default options.
Basemaps can be enabled or disabled via
tm_basemap():
tm + tm_basemap(NULL)
#> [view mode] WebGL does not work (yet) with projected map projections, so it has
#> been disabled.
#> This message is displayed once per session.Mode specific options
Mode specific layout options can be set via tm_plot()
and tm_view(). The number of options in
tm_plot() is limited to just two, because it uses all
general purpose options. In contrast, tm_view() contains
more options, e.g. the position of the control box and the default zoom
level:
For a more detailed description of the available options, see the vignette about options.
New modes
The new package tmap.mapgl offers two new modes,
"mapbox" and "maplibre":
Rotate bewteen modes
When more than two modes are loaded (now four), rtm()
can be used to rotate between modes:
rtm()
#> ℹ tmap modes "plot" -> "view" -> "mapbox" -> "maplibre"
#> ℹ rotate with `tmap::rtm()`switch to "view" with `tmap::ttm()`
rtm()
#> ℹ tmap modes "plot" -> "view" ->
#> "mapbox" -> "maplibre"This (and ttm()) is especially useful in interactive
sessinos. For scripts, it is recommend to use tmap_mode()
explicitly.
Modes "mapbox" and "maplibre".
For the mode "mapbox" an API key is required, which is
free for personal use. The mode maplibre is a fork of
mapbox before it sent from open to closed source. No API
key is required for maplibre.
These modes are not as feature rich (yet) as the "view"
mode, but they do offer a lot of new features: globe view and 3d
polygons. This is possible because of the support of WebGL, a fast
rendering technique. Therefore, these modes, and especially
maplibre for its open open source, are considered the
way forward in web mapping.
tmap_mode("maplibre")
#> ℹ tmap modes "plot" -> "view" ->
#> "mapbox" -> "maplibre"
tm