Glyphs in spatial data visualization are graphical symbols that represent data values at specific geographic locations. Each glyph can encode multiple data variables.
With the extension package tmap.glyphs (in development) glyphs can be created. Currently only the donut and flower glyphs are implemented.
Donut maps
ZH_muni = NLD_muni[NLD_muni$province == "Zuid-Holland", ]

ZH_muni$income_middle = 100 - ZH_muni$income_high - ZH_muni$income_low

tm_shape(ZH_muni) +
  tm_polygons() +
  tm_donuts(parts = tm_vars(c("income_low", "income_middle", "income_high"), multivariate = TRUE),
    fill.scale = tm_scale_categorical(values = "-pu_gn_div"),
    size = "population",
    lwd = 1,
    size.scale = tm_scale_continuous(ticks = c(50000, 100000, 250000, 500000)),
    options = opt_tm_donuts(fill_hole = FALSE))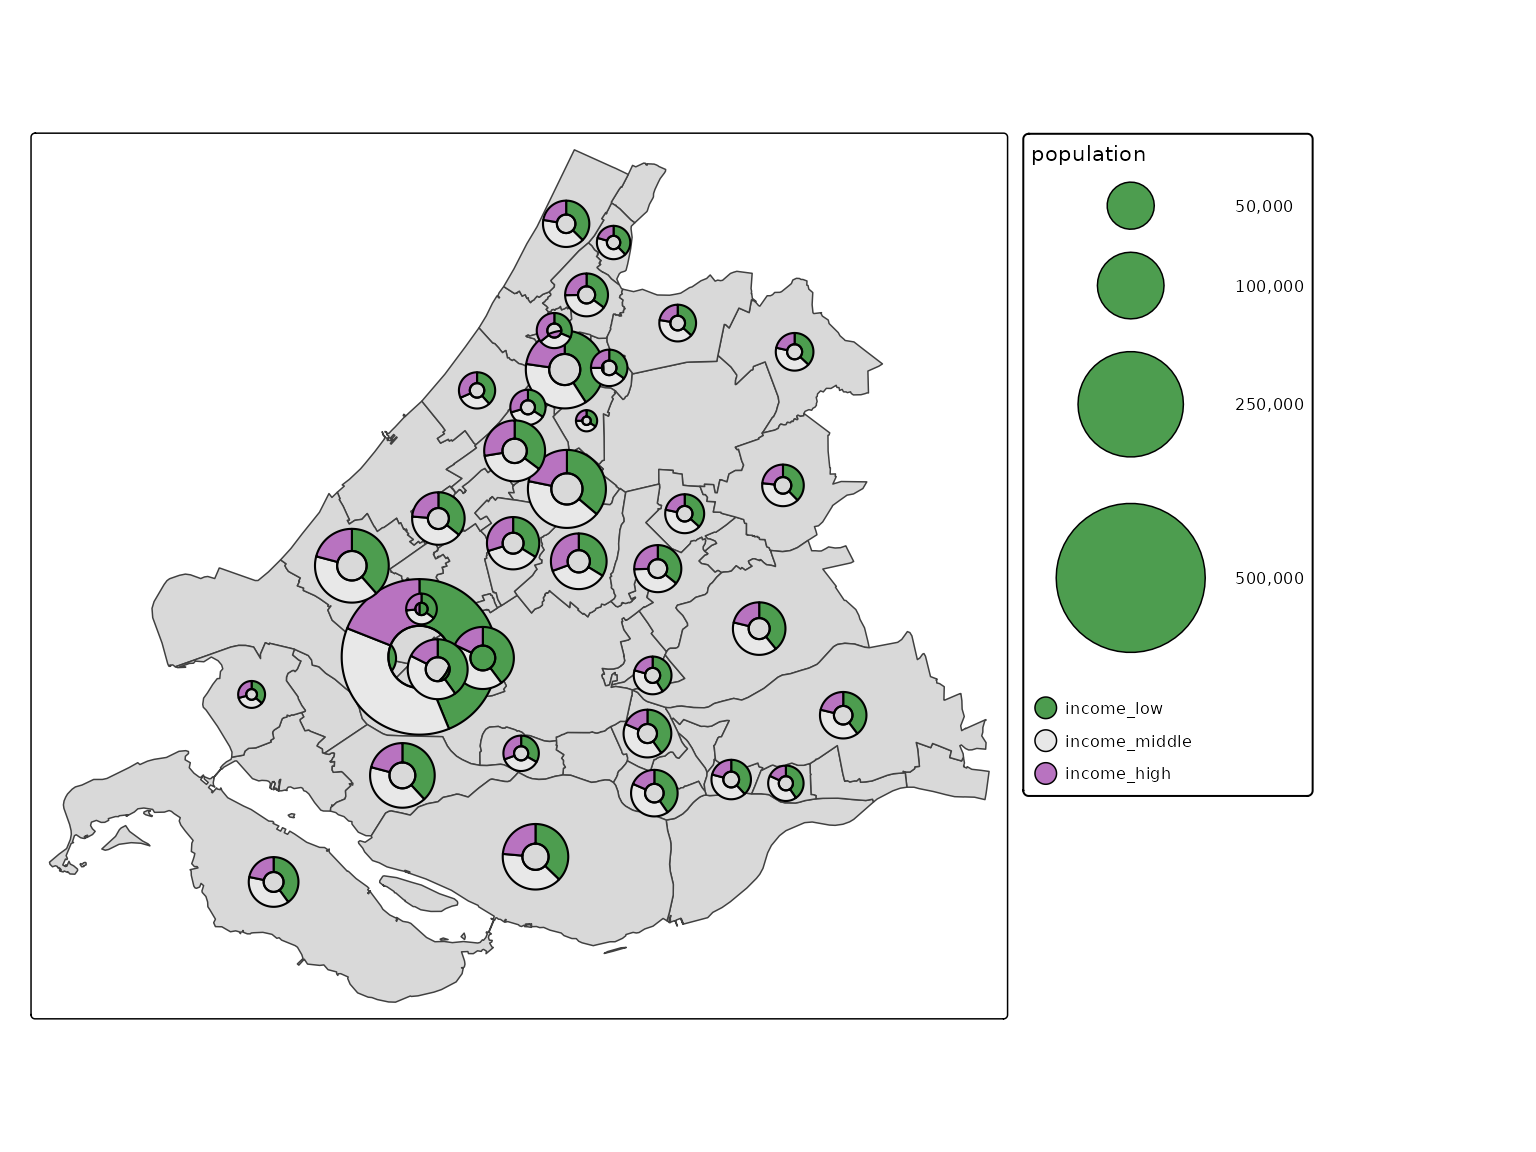
Flower maps
library(tmap.mapgl)
tmap_mode("maplibre")
#> ℹ tmap modes "plot" -> "view" -> "mapbox" -> "maplibre"
#> ℹ rotate with `tmap::rtm()`switch to "plot" with `tmap::ttm()`

q = function(x) {
    r = rank(x)
    r[is.na(x)] = NA
    r = r / max(r, na.rm = TRUE)
    r
}

World$rank_well_being = q((World$well_being / 8))
World$rank_footprint = q(((50 - World$footprint) / 50))
World$rank_inequality = q(((65 - World$inequality) / 65))
World$rank_press = q(1 - ((100 - World$press) / 100))
World$rank_gender = q(1 - World$gender)

tm_shape(World) +
  tm_polygons(fill = "white", popup = FALSE) +
tm_shape(World) +
  tm_flowers(
    parts =
      tm_vars(c("rank_gender", "rank_press", "rank_footprint",
              "rank_well_being", "rank_inequality"), multivariate = TRUE),
    fill.scale = tm_scale(values = "friendly5", labels = c("Gender", "Press freedom", "Footprint", "Well being", "Economic inequality")),
    size = 1.5,
    popup = tm_popup(
      vars = c("Gender" = "rank_gender",
             "Press freedom" = "rank_press",
             "Footprint" = "rank_footprint",
             "Well being" = "rank_well_being",
             "Economic inequality" =  "rank_inequality"),
      title = "name")) +
tm_basemap(NULL) +
tm_layout(bg.color = "grey90")
#> [tip] Consider a suitable map projection, e.g. by adding `+ tm_crs("auto")`.
#> This message is displayed once per session.