Set of tmap options that are directly related to the layout.
Usage
tm_style(style, ...)
tm_layout(
scale,
asp,
bg.color,
outer.bg.color,
frame,
frame.lwd,
frame.r,
frame.double_line,
outer.margins,
inner.margins,
inner.margins.extra,
meta.margins,
meta.auto_margins,
between_margin,
panel.margin,
component.offset,
component.stack_margin,
grid.mark.height,
xylab.height,
coords.height,
xlab.show,
xlab.text,
xlab.size,
xlab.color,
xlab.rotation,
xlab.space,
xlab.fontface,
xlab.fontfamily,
xlab.side,
ylab.show,
ylab.text,
ylab.size,
ylab.color,
ylab.rotation,
ylab.space,
ylab.fontface,
ylab.fontfamily,
ylab.side,
panel.type,
panel.wrap.pos,
panel.xtab.pos,
unit,
color.sepia_intensity,
color.saturation,
color_vision_deficiency_sim,
text.fontface,
text.fontfamily,
component.position,
component.autoscale,
legend.show,
legend.design,
legend.orientation,
legend.position,
legend.width,
legend.height,
legend.stack,
legend.group.frame,
legend.resize_as_group,
legend.reverse,
legend.na.show,
legend.title.color,
legend.title.size,
legend.title.fontface,
legend.title.fontfamily,
legend.xlab.color,
legend.xlab.size,
legend.xlab.fontface,
legend.xlab.fontfamily,
legend.ylab.color,
legend.ylab.size,
legend.ylab.fontface,
legend.ylab.fontfamily,
legend.text.color,
legend.text.size,
legend.text.fontface,
legend.text.fontfamily,
legend.frame,
legend.frame.lwd,
legend.frame.r,
legend.bg.color,
legend.bg.alpha,
legend.only,
legend.settings.standard.portrait,
legend.settings.standard.landscape,
chart.show,
chart.plot.axis.x,
chart.plot.axis.y,
chart.position,
chart.width,
chart.height,
chart.stack,
chart.group.frame,
chart.resize_as_group,
chart.reverse,
chart.na.show,
chart.title.color,
chart.title.size,
chart.title.fontface,
chart.title.fontfamily,
chart.xlab.color,
chart.xlab.size,
chart.xlab.fontface,
chart.xlab.fontfamily,
chart.ylab.color,
chart.ylab.size,
chart.ylab.fontface,
chart.ylab.fontfamily,
chart.text.color,
chart.text.size,
chart.text.fontface,
chart.text.fontfamily,
chart.frame,
chart.frame.lwd,
chart.frame.r,
chart.bg.color,
chart.bg.alpha,
chart.object.color,
title.show,
title.size,
title.color,
title.fontface,
title.fontfamily,
title.bg.color,
title.bg.alpha,
title.padding,
title.frame,
title.frame.lwd,
title.frame.r,
title.stack,
title.position,
title.width,
title.group.frame,
title.resize_as_group,
credits.show,
credits.size,
credits.color,
credits.fontface,
credits.fontfamily,
credits.bg.color,
credits.bg.alpha,
credits.padding,
credits.frame,
credits.frame.lwd,
credits.frame.r,
credits.stack,
credits.position,
credits.width,
credits.height,
credits.group.frame,
credits.resize_as_group,
compass.north,
compass.type,
compass.text.size,
compass.size,
compass.show.labels,
compass.cardinal.directions,
compass.text.color,
compass.color.dark,
compass.color.light,
compass.lwd,
compass.bg.color,
compass.bg.alpha,
compass.margins,
compass.show,
compass.stack,
compass.position,
compass.frame,
compass.frame.lwd,
compass.frame.r,
compass.group.frame,
compass.resize_as_group,
logo.height,
logo.margins,
logo.between_margin,
logo.show,
logo.stack,
logo.position,
logo.frame,
logo.frame.lwd,
logo.frame.r,
logo.group.frame,
logo.resize_as_group,
scalebar.show,
scalebar.breaks,
scalebar.width,
scalebar.text.size,
scalebar.text.color,
scalebar.color.dark,
scalebar.color.light,
scalebar.lwd,
scalebar.bg.color,
scalebar.bg.alpha,
scalebar.size,
scalebar.margins,
scalebar.stack,
scalebar.position,
scalebar.frame,
scalebar.frame.lwd,
scalebar.frame.r,
scalebar.group.frame,
scalebar.resize_as_group,
grid.show,
grid.labels.pos,
grid.x,
grid.y,
grid.n.x,
grid.n.y,
grid.crs,
grid.col,
grid.lwd,
grid.alpha,
grid.labels.show,
grid.labels.size,
grid.labels.col,
grid.labels.rot,
grid.labels.format,
grid.labels.cardinal,
grid.labels.margin.x,
grid.labels.margin.y,
grid.labels.space.x,
grid.labels.space.y,
grid.labels.inside_frame,
grid.ticks,
grid.lines,
grid.ndiscr,
mouse_coordinates.stack,
mouse_coordinates.position,
mouse_coordinates.show,
minimap.server,
minimap.toggle,
minimap.stack,
minimap.position,
minimap.show,
panel.show,
panel.labels,
panel.label.size,
panel.label.color,
panel.label.fontface,
panel.label.fontfamily,
panel.label.bg.color,
panel.label.frame,
panel.label.frame.lwd,
panel.label.frame.r,
panel.label.height,
panel.label.rot,
bbox,
set_bounds,
set_view,
set_zoom_limits,
qtm.scalebar,
qtm.minimap,
qtm.mouse_coordinates,
earth_boundary,
earth_boundary.color,
earth_boundary.lwd,
earth_datum,
space.color,
check_and_fix,
basemap.show,
basemap.server,
basemap.alpha,
basemap.zoom,
tiles.show,
tiles.server,
tiles.alpha,
tiles.zoom,
attr.color,
title = NULL,
...
)
tm_crs(crs)
Arguments
- style
name of the style
- ...
List of tmap options to be set, or option names (characters) to be returned (see details)
- scale
Overall scale of the map
- asp
Aspect ratio of each map. When
asp
is set toNA
(default) the aspect ratio will be adjusted to the used shapes. When set to 0 the aspect ratio is adjusted to the size of the device divided by the number of columns and rows.- bg.color
Background color of the map.
- outer.bg.color
Background color of map outside the frame.
- frame
The frame of the .
- frame.lwd
The line width of the frame. See
graphics::par
, option 'lwd'.- frame.r
The r (radius) of the frame.
- frame.double_line
The double line of the frame.
TRUE
orFALSE
.- outer.margins
The margins of the outer space (outside the frame. A vector of 4 values: bottom, left, top, right. The unit is the device height (for bottom and top) or width (for left and right).
- inner.margins
The margins of the inner space (inside the frame). A vector of 4 values: bottom, left, top, right. The unit is the device height (for bottom and top) or width (for left and right).
- inner.margins.extra
The extra arguments of the margins of the inner space (inside the frame). A list of arguments.
- meta.margins
The margins of the meta. A vector of 4 values: bottom, left, top, right. The unit is the device height (for bottom and top) or width (for left and right).
- meta.auto_margins
The auto_margins of the meta.
- between_margin
The between_margin of the .
- panel.margin
The margin of the panel.
- component.offset
The offset of the component.
- component.stack_margin
The stack_margin of the component.
- grid.mark.height
The height of the mark of the grid.
- xylab.height
The height of the xylab.
- coords.height
The height of the coords.
- xlab.show
The visibility of the xlab.
TRUE
orFALSE
.- xlab.text
The text of the xlab.
- xlab.size
The size of the xlab.
- xlab.color
The color of the xlab.
- xlab.rotation
The rotation of the xlab.
- xlab.space
The space of the xlab. In terms of number of line heights.
- xlab.fontface
The font face of the xlab. See
graphics::par
, option 'font'.- xlab.fontfamily
The font family of the xlab. See
graphics::par
, option 'family'.- xlab.side
The side of the xlab.
- ylab.show
The visibility of the ylab.
TRUE
orFALSE
.- ylab.text
The text of the ylab.
- ylab.size
The size of the ylab.
- ylab.color
The color of the ylab.
- ylab.rotation
The rotation of the ylab.
- ylab.space
The space of the ylab. In terms of number of line heights.
- ylab.fontface
The font face of the ylab. See
graphics::par
, option 'font'.- ylab.fontfamily
The font family of the ylab. See
graphics::par
, option 'family'.- ylab.side
The side of the ylab.
- panel.type
The type of the panel.
- panel.wrap.pos
The panel positions for wrapped facets created with
tm_facets_grid()
. One of"left"
,"right"
,"top"
(default) or"bottom"
.- panel.xtab.pos
The panel positions for grid facets created with
tm_facets_grid()
. Vector of two, where the first determines the locations of row panels ("left"
or"right"
) and the second the location of column panels ("top"
or `"bottom")- unit
Unit of the coordinate
- color.sepia_intensity
The sepia_intensity of the color.
- color.saturation
The saturation of the color.
- color_vision_deficiency_sim
The color_vision_deficiency_sim of the .
- text.fontface
The font face of the text. See
graphics::par
, option 'font'.- text.fontfamily
The font family of the text. See
graphics::par
, option 'family'.- component.position
The position of the component.
- component.autoscale
The autoscale of the component.
- legend.show
The visibility of the legend.
TRUE
orFALSE
.- legend.design
The design of the legend.
- legend.orientation
The orientation of the legend.
- legend.position
The position of the legend.
- legend.width
The width of the legend.
- legend.height
The height of the legend.
- legend.stack
The stack of the legend.
- legend.group.frame
The frame of the group of the legend.
- legend.resize_as_group
The resize_as_group of the legend.
- legend.reverse
The reverse of the legend.
- legend.na.show
The visibility of the na of the legend.
TRUE
orFALSE
.- legend.title.color
The color of the title of the legend.
- legend.title.size
The size of the title of the legend.
- legend.title.fontface
The font face of the title of the legend. See
graphics::par
, option 'font'.- legend.title.fontfamily
The font family of the title of the legend. See
graphics::par
, option 'family'.- legend.xlab.color
The color of the xlab of the legend.
- legend.xlab.size
The size of the xlab of the legend.
- legend.xlab.fontface
The font face of the xlab of the legend. See
graphics::par
, option 'font'.- legend.xlab.fontfamily
The font family of the xlab of the legend. See
graphics::par
, option 'family'.- legend.ylab.color
The color of the ylab of the legend.
- legend.ylab.size
The size of the ylab of the legend.
- legend.ylab.fontface
The font face of the ylab of the legend. See
graphics::par
, option 'font'.- legend.ylab.fontfamily
The font family of the ylab of the legend. See
graphics::par
, option 'family'.- legend.text.color
The color of the text of the legend.
- legend.text.size
The size of the text of the legend.
- legend.text.fontface
The font face of the text of the legend. See
graphics::par
, option 'font'.- legend.text.fontfamily
The font family of the text of the legend. See
graphics::par
, option 'family'.- legend.frame
The frame of the legend.
- legend.frame.lwd
The line width of the frame of the legend. See
graphics::par
, option 'lwd'.- legend.frame.r
The r (radius) of the frame of the legend.
- legend.bg.color
The color of the bg of the legend.
- legend.bg.alpha
The alpha transparency of the bg of the legend.
- legend.only
The only of the legend.
- legend.settings.standard.portrait
The portrait of the standard of the settings of the legend.
- legend.settings.standard.landscape
The landscape of the standard of the settings of the legend.
- chart.show
The visibility of the chart.
TRUE
orFALSE
.- chart.plot.axis.x
The x of the axis of the plot of the chart.
- chart.plot.axis.y
The y of the axis of the plot of the chart.
- chart.position
The position of the chart.
- chart.width
The width of the chart.
- chart.height
The height of the chart.
- chart.stack
The stack of the chart.
- chart.group.frame
The frame of the group of the chart.
- chart.resize_as_group
The resize_as_group of the chart.
- chart.reverse
The reverse of the chart.
- chart.na.show
The visibility of the na of the chart.
TRUE
orFALSE
.- chart.title.color
The color of the title of the chart.
- chart.title.size
The size of the title of the chart.
- chart.title.fontface
The font face of the title of the chart. See
graphics::par
, option 'font'.- chart.title.fontfamily
The font family of the title of the chart. See
graphics::par
, option 'family'.- chart.xlab.color
The color of the xlab of the chart.
- chart.xlab.size
The size of the xlab of the chart.
- chart.xlab.fontface
The font face of the xlab of the chart. See
graphics::par
, option 'font'.- chart.xlab.fontfamily
The font family of the xlab of the chart. See
graphics::par
, option 'family'.- chart.ylab.color
The color of the ylab of the chart.
- chart.ylab.size
The size of the ylab of the chart.
- chart.ylab.fontface
The font face of the ylab of the chart. See
graphics::par
, option 'font'.- chart.ylab.fontfamily
The font family of the ylab of the chart. See
graphics::par
, option 'family'.- chart.text.color
The color of the text of the chart.
- chart.text.size
The size of the text of the chart.
- chart.text.fontface
The font face of the text of the chart. See
graphics::par
, option 'font'.- chart.text.fontfamily
The font family of the text of the chart. See
graphics::par
, option 'family'.- chart.frame
The frame of the chart.
- chart.frame.lwd
The line width of the frame of the chart. See
graphics::par
, option 'lwd'.- chart.frame.r
The r (radius) of the frame of the chart.
- chart.bg.color
The color of the bg of the chart.
- chart.bg.alpha
The alpha transparency of the bg of the chart.
- chart.object.color
The color of the object of the chart.
- title.show
The visibility of the title.
TRUE
orFALSE
.- title.size
The size of the title.
- title.color
The color of the title.
- title.fontface
The font face of the title. See
graphics::par
, option 'font'.- title.fontfamily
The font family of the title. See
graphics::par
, option 'family'.- title.bg.color
The color of the bg of the title.
- title.bg.alpha
The alpha transparency of the bg of the title.
- title.padding
The padding of the title. A vector of 4 values: bottom, left, top, right. The unit is the device height (for bottom and top) or width (for left and right).
- title.frame
The frame of the title.
- title.frame.lwd
The line width of the frame of the title. See
graphics::par
, option 'lwd'.- title.frame.r
The r (radius) of the frame of the title.
- title.stack
The stack of the title.
- title.position
The position of the title.
- title.width
The width of the title.
- title.group.frame
The frame of the group of the title.
- title.resize_as_group
The resize_as_group of the title.
- credits.show
The visibility of the credits.
TRUE
orFALSE
.- credits.size
The size of the credits.
- credits.color
The color of the credits.
- credits.fontface
The font face of the credits. See
graphics::par
, option 'font'.- credits.fontfamily
The font family of the credits. See
graphics::par
, option 'family'.- credits.bg.color
The color of the bg of the credits.
- credits.bg.alpha
The alpha transparency of the bg of the credits.
- credits.padding
The padding of the credits. A vector of 4 values: bottom, left, top, right. The unit is the device height (for bottom and top) or width (for left and right).
- credits.frame
The frame of the credits.
- credits.frame.lwd
The line width of the frame of the credits. See
graphics::par
, option 'lwd'.- credits.frame.r
The r (radius) of the frame of the credits.
- credits.stack
The stack of the credits.
- credits.position
The position of the credits.
- credits.width
The width of the credits.
- credits.height
The height of the credits.
- credits.group.frame
The frame of the group of the credits.
- credits.resize_as_group
The resize_as_group of the credits.
- compass.north
The north of the compass.
- compass.type
The type of the compass.
- compass.text.size
The size of the text of the compass.
- compass.size
The size of the compass.
- compass.show.labels
The labels of the show of the compass.
- compass.cardinal.directions
The directions of the cardinal of the compass.
- compass.text.color
The color of the text of the compass.
- compass.color.dark
The dark of the color of the compass.
- compass.color.light
The light of the color of the compass.
- compass.lwd
The line width of the compass. See
graphics::par
, option 'lwd'.- compass.bg.color
The color of the bg of the compass.
- compass.bg.alpha
The alpha transparency of the bg of the compass.
- compass.margins
The margins of the compass. A vector of 4 values: bottom, left, top, right. The unit is the device height (for bottom and top) or width (for left and right).
- compass.show
The visibility of the compass.
TRUE
orFALSE
.- compass.stack
The stack of the compass.
- compass.position
The position of the compass.
- compass.frame
The frame of the compass.
- compass.frame.lwd
The line width of the frame of the compass. See
graphics::par
, option 'lwd'.- compass.frame.r
The r (radius) of the frame of the compass.
- compass.group.frame
The frame of the group of the compass.
- compass.resize_as_group
The resize_as_group of the compass.
- logo.height
The height of the logo.
- logo.margins
The margins of the logo. A vector of 4 values: bottom, left, top, right. The unit is the device height (for bottom and top) or width (for left and right).
- logo.between_margin
The between_margin of the logo.
- logo.show
The visibility of the logo.
TRUE
orFALSE
.- logo.stack
The stack of the logo.
- logo.position
The position of the logo.
- logo.frame
The frame of the logo.
- logo.frame.lwd
The line width of the frame of the logo. See
graphics::par
, option 'lwd'.- logo.frame.r
The r (radius) of the frame of the logo.
- logo.group.frame
The frame of the group of the logo.
- logo.resize_as_group
The resize_as_group of the logo.
- scalebar.show
The visibility of the scalebar.
TRUE
orFALSE
.- scalebar.breaks
The break values of the scalebar.
- scalebar.width
The width of the scalebar.
- scalebar.text.size
The size of the text of the scalebar.
- scalebar.text.color
The color of the text of the scalebar.
- scalebar.color.dark
The dark of the color of the scalebar.
- scalebar.color.light
The light of the color of the scalebar.
- scalebar.lwd
The line width of the scalebar. See
graphics::par
, option 'lwd'.- scalebar.bg.color
The color of the bg of the scalebar.
- scalebar.bg.alpha
The alpha transparency of the bg of the scalebar.
- scalebar.size
The size of the scalebar.
- scalebar.margins
The margins of the scalebar. A vector of 4 values: bottom, left, top, right. The unit is the device height (for bottom and top) or width (for left and right).
- scalebar.stack
The stack of the scalebar.
- scalebar.position
The position of the scalebar.
- scalebar.frame
The frame of the scalebar.
- scalebar.frame.lwd
The line width of the frame of the scalebar. See
graphics::par
, option 'lwd'.- scalebar.frame.r
The r (radius) of the frame of the scalebar.
- scalebar.group.frame
The frame of the group of the scalebar.
- scalebar.resize_as_group
The resize_as_group of the scalebar.
- grid.show
The visibility of the grid.
TRUE
orFALSE
.- grid.labels.pos
The pos of the labels of the grid.
- grid.x
The x of the grid.
- grid.y
The y of the grid.
- grid.n.x
The x of the n of the grid.
- grid.n.y
The y of the n of the grid.
- grid.crs
The coordinate reference system (CRS) of the grid.
- grid.col
The color of the grid.
- grid.lwd
The line width of the grid. See
graphics::par
, option 'lwd'.- grid.alpha
The alpha transparency of the grid.
- grid.labels.show
The visibility of the labels of the grid.
TRUE
orFALSE
.- grid.labels.size
The size of the labels of the grid.
- grid.labels.col
The color of the labels of the grid.
- grid.labels.rot
The rot of the labels of the grid.
- grid.labels.format
The format of the labels of the grid.
- grid.labels.cardinal
The cardinal of the labels of the grid.
- grid.labels.margin.x
The x of the margin of the labels of the grid.
- grid.labels.margin.y
The y of the margin of the labels of the grid.
- grid.labels.space.x
The x of the space of the labels of the grid.
- grid.labels.space.y
The y of the space of the labels of the grid.
- grid.labels.inside_frame
The inside_frame of the labels of the grid.
- grid.ticks
The ticks of the grid.
- grid.lines
The lines of the grid.
- grid.ndiscr
The ndiscr of the grid.
- mouse_coordinates.stack
The stack of the mouse_coordinates.
- mouse_coordinates.position
The position of the mouse_coordinates.
- mouse_coordinates.show
The visibility of the mouse_coordinates.
TRUE
orFALSE
.- minimap.server
The server of the minimap.
- minimap.toggle
The toggle of the minimap.
- minimap.stack
The stack of the minimap.
- minimap.position
The position of the minimap.
- minimap.show
The visibility of the minimap.
TRUE
orFALSE
.- panel.show
The visibility of the panel.
TRUE
orFALSE
.- panel.labels
The labels of the panel.
- panel.label.size
The size of the label of the panel.
- panel.label.color
The color of the label of the panel.
- panel.label.fontface
The font face of the label of the panel. See
graphics::par
, option 'font'.- panel.label.fontfamily
The font family of the label of the panel. See
graphics::par
, option 'family'.- panel.label.bg.color
The color of the bg of the label of the panel.
- panel.label.frame
The frame of the label of the panel.
- panel.label.frame.lwd
The line width of the frame of the label of the panel. See
graphics::par
, option 'lwd'.- panel.label.frame.r
The r (radius) of the frame of the label of the panel.
- panel.label.height
The height of the label of the panel.
- panel.label.rot
The rot of the label of the panel.
- bbox
Bounding box of the map (only used if
shp
is the main shape (seeis.main
)- set_bounds
logical that determines whether maximum bounds are set, or a bounding box. Not applicable in plot mode. In view mode, this is passed on to setMaxBounds()
- set_view
numeric vector that determines the view. Either a vector of three:
lng
,lat
, andzoom
, or a single value:zoom
. See setView(). Only applicable ifbbox
is not specified- set_zoom_limits
numeric vector of two that set the minimum and maximum zoom levels (see tileOptions()).
- qtm.scalebar
The scalebar of the qtm.
- qtm.minimap
The minimap of the qtm.
- qtm.mouse_coordinates
The mouse_coordinates of the qtm.
- earth_boundary
The earth_boundary of the .
- earth_boundary.color
The color of the earth_boundary.
- earth_boundary.lwd
The line width of the earth_boundary. See
graphics::par
, option 'lwd'.- earth_datum
Earth datum
- space.color
The color of the space.
- check_and_fix
Should attempt to fix an invalid shapefile
- basemap.show
The visibility of the basemap.
TRUE
orFALSE
.- basemap.server
The server of the basemap.
- basemap.alpha
The alpha transparency of the basemap.
- basemap.zoom
The zoom of the basemap.
- tiles.show
The visibility of the tiles.
TRUE
orFALSE
.- tiles.server
The server of the tiles.
- tiles.alpha
The alpha transparency of the tiles.
- tiles.zoom
The zoom of the tiles.
- attr.color
The color of the attr.
- title
deprecated See
tm_title()
- crs
Map crs (see
tm_shape()
).NA
means the crs is specified intm_shape()
. The crs that is used by the transformation functions is defined intm_shape()
.
Examples
data(land, World)
# Error unable to warp stars (argument not yet added to tm_shape)
# On Windows
if (FALSE) { # \dontrun{
tm_shape(land, raster.wrap = FALSE) +
tm_raster(
"elevation",
col.scale = tm_scale_intervals(
breaks = c(-Inf, 250, 500, 1000, 1500, 2000, 2500, 3000, 4000, Inf),
values = terrain.colors(9), midpoint = NA
),
col.legend = tm_legend(
title = "Elevation", position = tm_pos_in("left", "bottom"),
frame = TRUE, bg.color = "lightblue"
)
) +
tm_shape(World, is.main = TRUE, crs = "+proj=eck4") +
tm_borders("grey20") +
tm_graticules(labels.size = .5) +
tm_text("name", size = "AREA") +
# tm_compass(position = c(.65, .15), color.light = "grey90") +
# tm_credits("Eckert IV projection", position = c("right", "BOTTOM")) +
tm_style("classic_v3") +
tm_layout(bg.color = "lightblue", inner.margins = c(0, 0, .02, 0))
} # }
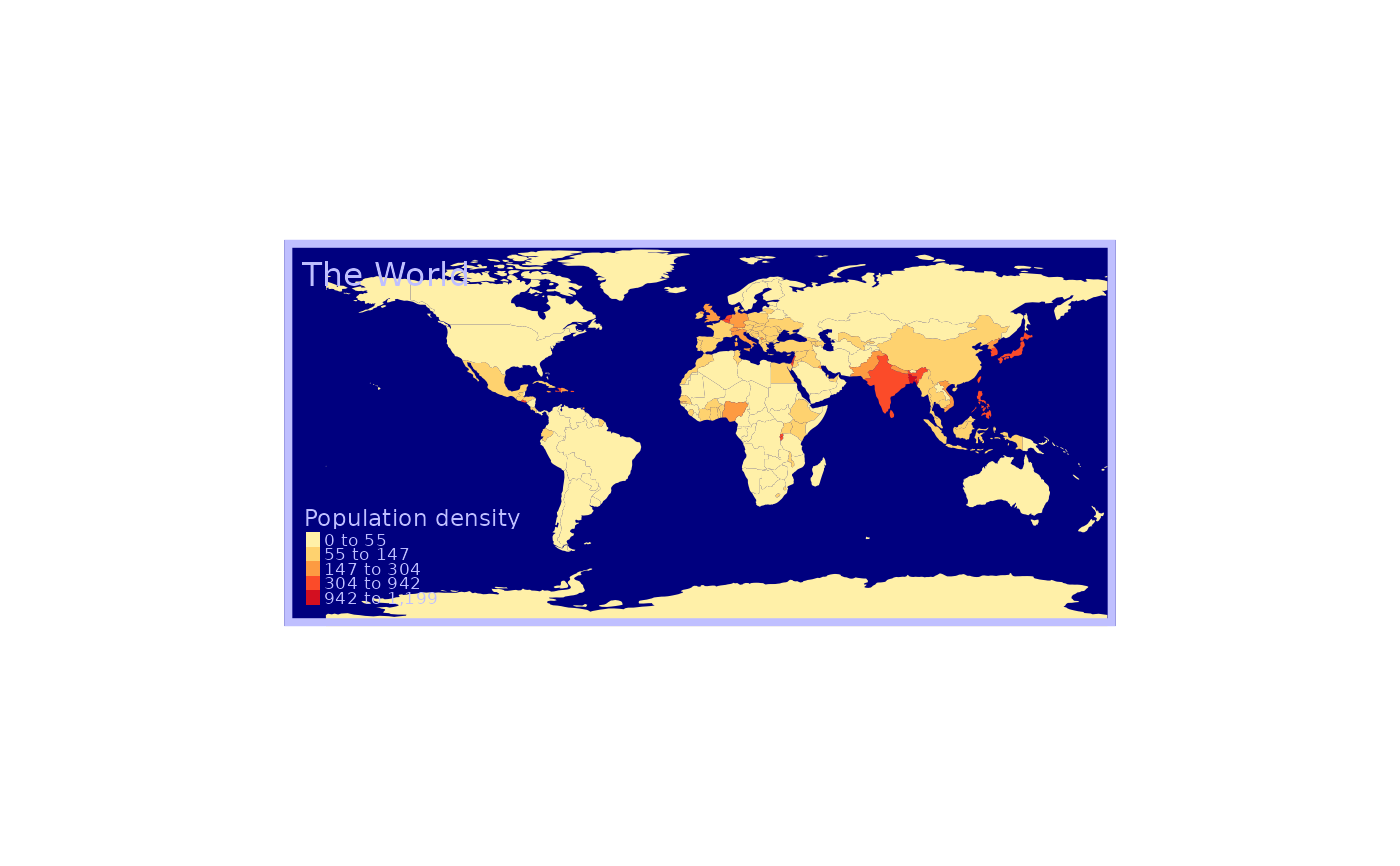
data(land, World)
tm_shape(World) +
tm_fill("pop_est_dens", fill.scale = tm_scale_intervals(style = "kmeans"),
fill.legend = tm_legend(title = "Population density")) +
tm_style("albatross_v3", frame.lwd = 10) +
tm_format("World") +
tm_title("The World", position = tm_pos_in("left", "top"))
#> [deprecated] `tm_format("World")` is deprecated as of tmap 4.0. Instead, please
#> use `tm_layout(inner.margins=c(0, 0.05, 0.025, 0.01),
#> legend.position=tm_pos_in("left", "bottom"), component.position=c("right",
#> "bottom"), scale=.8, title.size = 1.3)`
################################
# not working yet:
################################
if (FALSE) { # \dontrun{
tm_shape(land) +
tm_raster("elevation",
breaks=c(-Inf, 250, 500, 1000, 1500, 2000, 2500, 3000, 4000, Inf),
palette = terrain.colors(9), title="Elevation", midpoint = NA) +
tm_shape(World, is.master=TRUE, projection = "+proj=eck4") +
tm_borders("grey20") +
tm_graticules(labels.size = .5) +
tm_text("name", size="AREA") +
tm_compass(position = c(.65, .15), color.light = "grey90") +
tm_credits("Eckert IV projection", position = c("right", "BOTTOM")) +
tm_style("classic") +
tm_layout(bg.color="lightblue",
inner.margins=c(.04,.03, .02, .01),
earth_boundary = TRUE,
space.color="grey90") +
tm_legend(position = c("left", "bottom"),
frame = TRUE,
bg.color="lightblue")
} # }
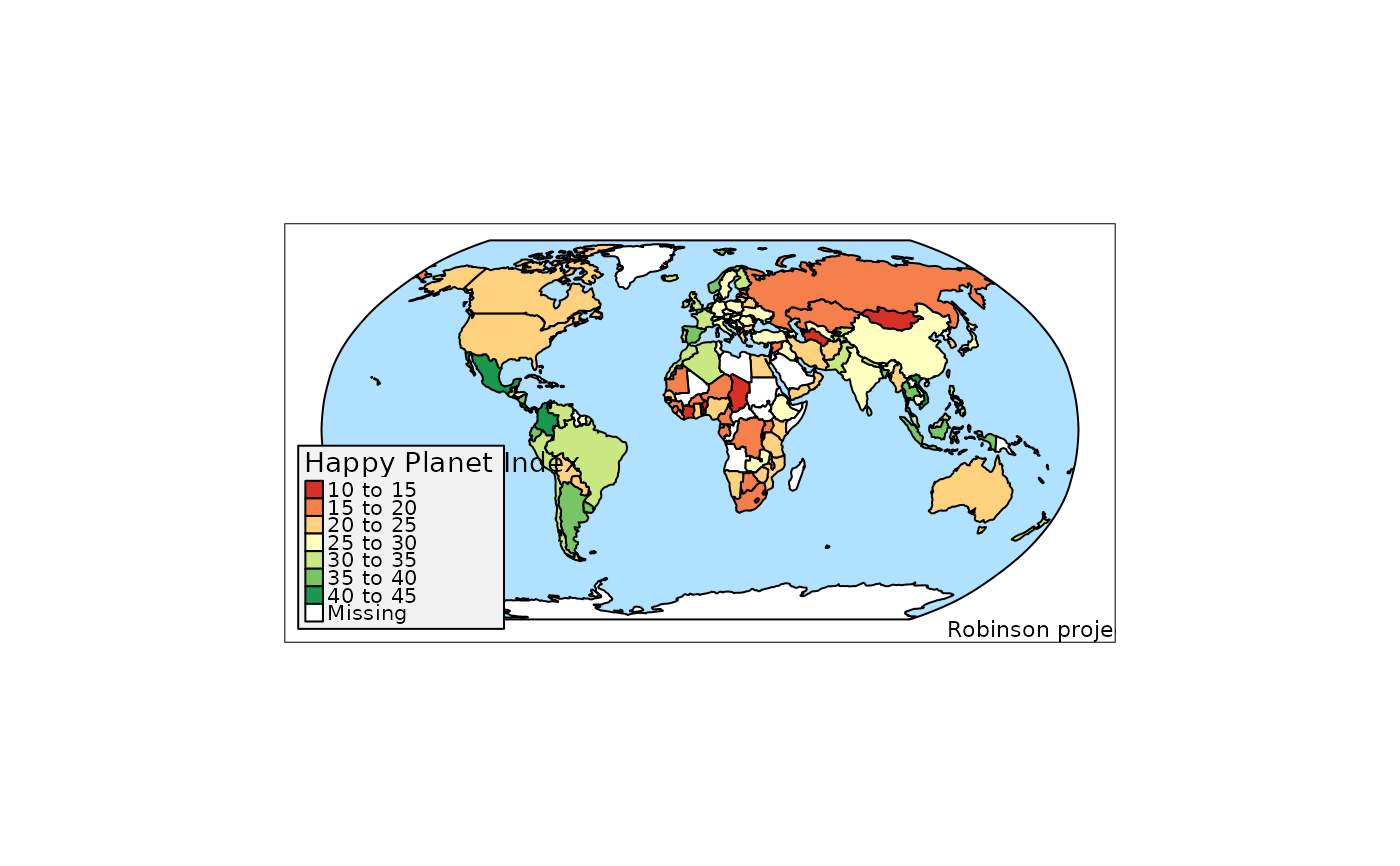
tm_shape(World, projection="+proj=robin") +
tm_polygons("HPI", palette="div", n=7,
title = "Happy Planet Index") +
tm_credits("Robinson projection", position = c("right", "BOTTOM")) +
tm_style("natural", earth_boundary = c(-180, -87, 180, 87), inner.margins = .05) +
tm_legend(position=c("left", "bottom"), bg.color="grey95", frame=TRUE)
#>
#> ── tmap v3 code detected ───────────────────────────────────────────────────────
#> [v3->v4] `tm_shape()`: use `crs` instead of `projection`.
#> [v3->v4] `tm_tm_polygons()`: migrate the argument(s) related to the scale of
#> the visual variable `fill` namely 'n', 'palette' (rename to 'values') to
#> fill.scale = tm_scale(<HERE>).
#> [v3->v4] `tm_polygons()`: migrate the argument(s) related to the legend of the
#> visual variable `fill` namely 'title' to 'fill.legend = tm_legend(<HERE>)'
#> [v3->v4] `tm_legend()`: use 'tm_legend()' inside a layer function, e.g.
#> 'tm_polygons(..., fill.legend = tm_legend())'
#> This message is displayed once every 8 hours.
# Not working yet
if (FALSE) { # \dontrun{
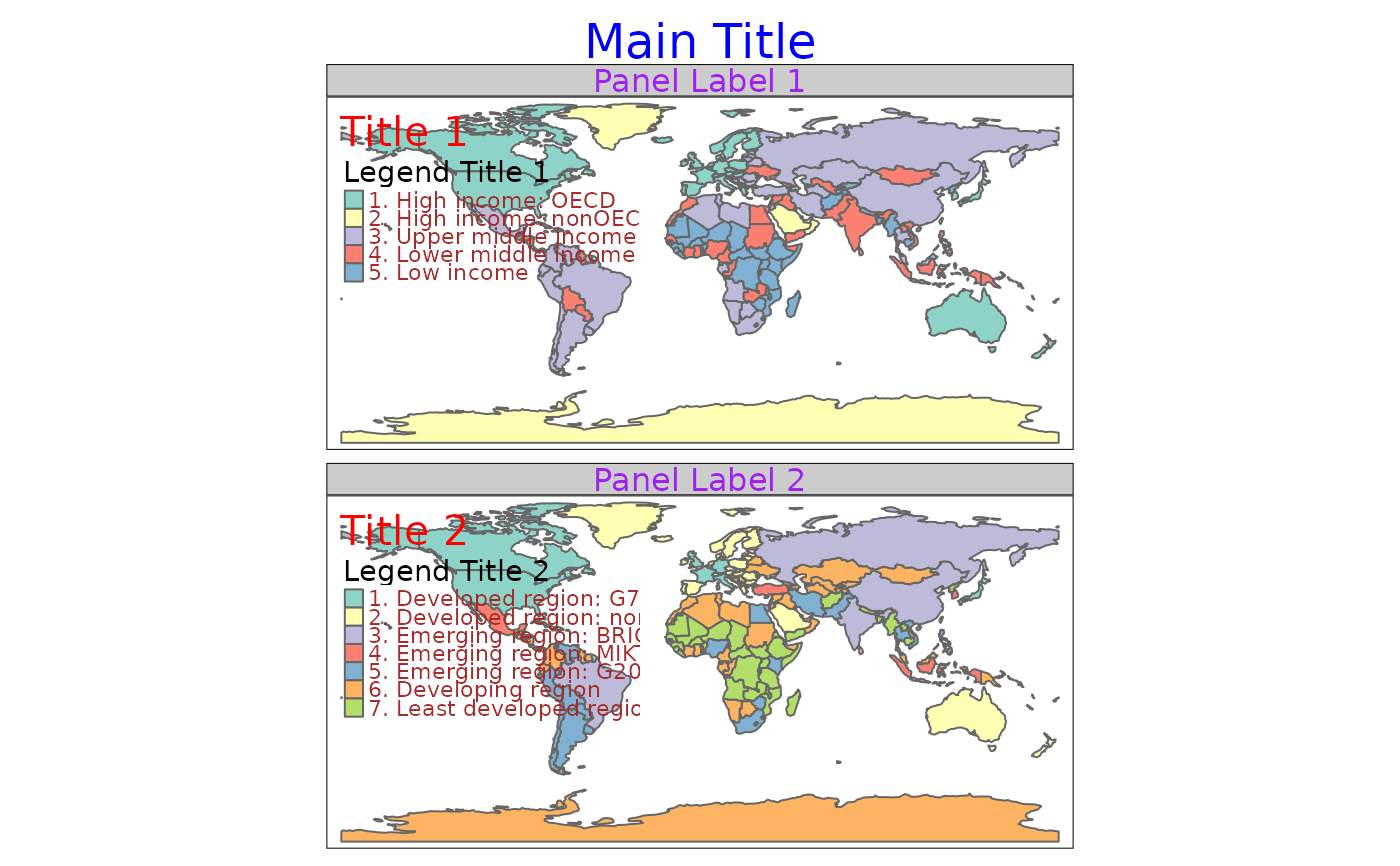
# Example to illustrate the type of titles
tm_shape(World) +
tm_polygons(c("income_grp", "economy"), title = c("Legend Title 1", "Legend Title 2")) +
tm_layout(main.title = "Main Title",
main.title.position = "center",
main.title.color = "blue",
title = c("Title 1", "Title 2"),
title.color = "red",
panel.labels = c("Panel Label 1", "Panel Label 2"),
panel.label.color = "purple",
legend.text.color = "brown")
} # }
if (FALSE) { # \dontrun{
# global option tmap.style demo
# get current style
current.style <- tmap_style()
qtm(World, fill = "economy", format = "World")
tmap_style("col_blind")
qtm(World, fill = "economy", format = "World")
tmap_style("cobalt")
qtm(World, fill = "economy", format = "World")
# set to current style
tmap_style(current.style)
} # }
# TIP: check out these examples in view mode, enabled with tmap_mode("view")