About the data
A spatial data object contained in tmap is called World. It is a data frame with a row for each country. The columns are the following data variables plus an additional geometry column which contains the geometries (see sf package):
names(World)
#>  [1] "iso_a3"       "name"         "sovereignt"   "continent"    "area"
#>  [6] "pop_est"      "pop_est_dens" "economy"      "income_grp"   "gdp_cap_est"
#> [11] "life_exp"     "well_being"   "footprint"    "HPI"          "inequality"
#> [16] "gender"       "press"        "geometry"
We specify this object with tm_shape (see other vignette) and for convenience assign it to s:
s = tm_shape(World, crs = "+proj=eqearth")Legend type
Each map variable, e.g. fill in tm_polygons will by default produce a legend. The type of legend depends on used scale (see ). E.g. tm_scale_continuous applied to fill will produce a continuous color gradient:
s + tm_polygons(
  fill = "HPI",
  fill.scale = tm_scale_continuous(values = "pu_gn"))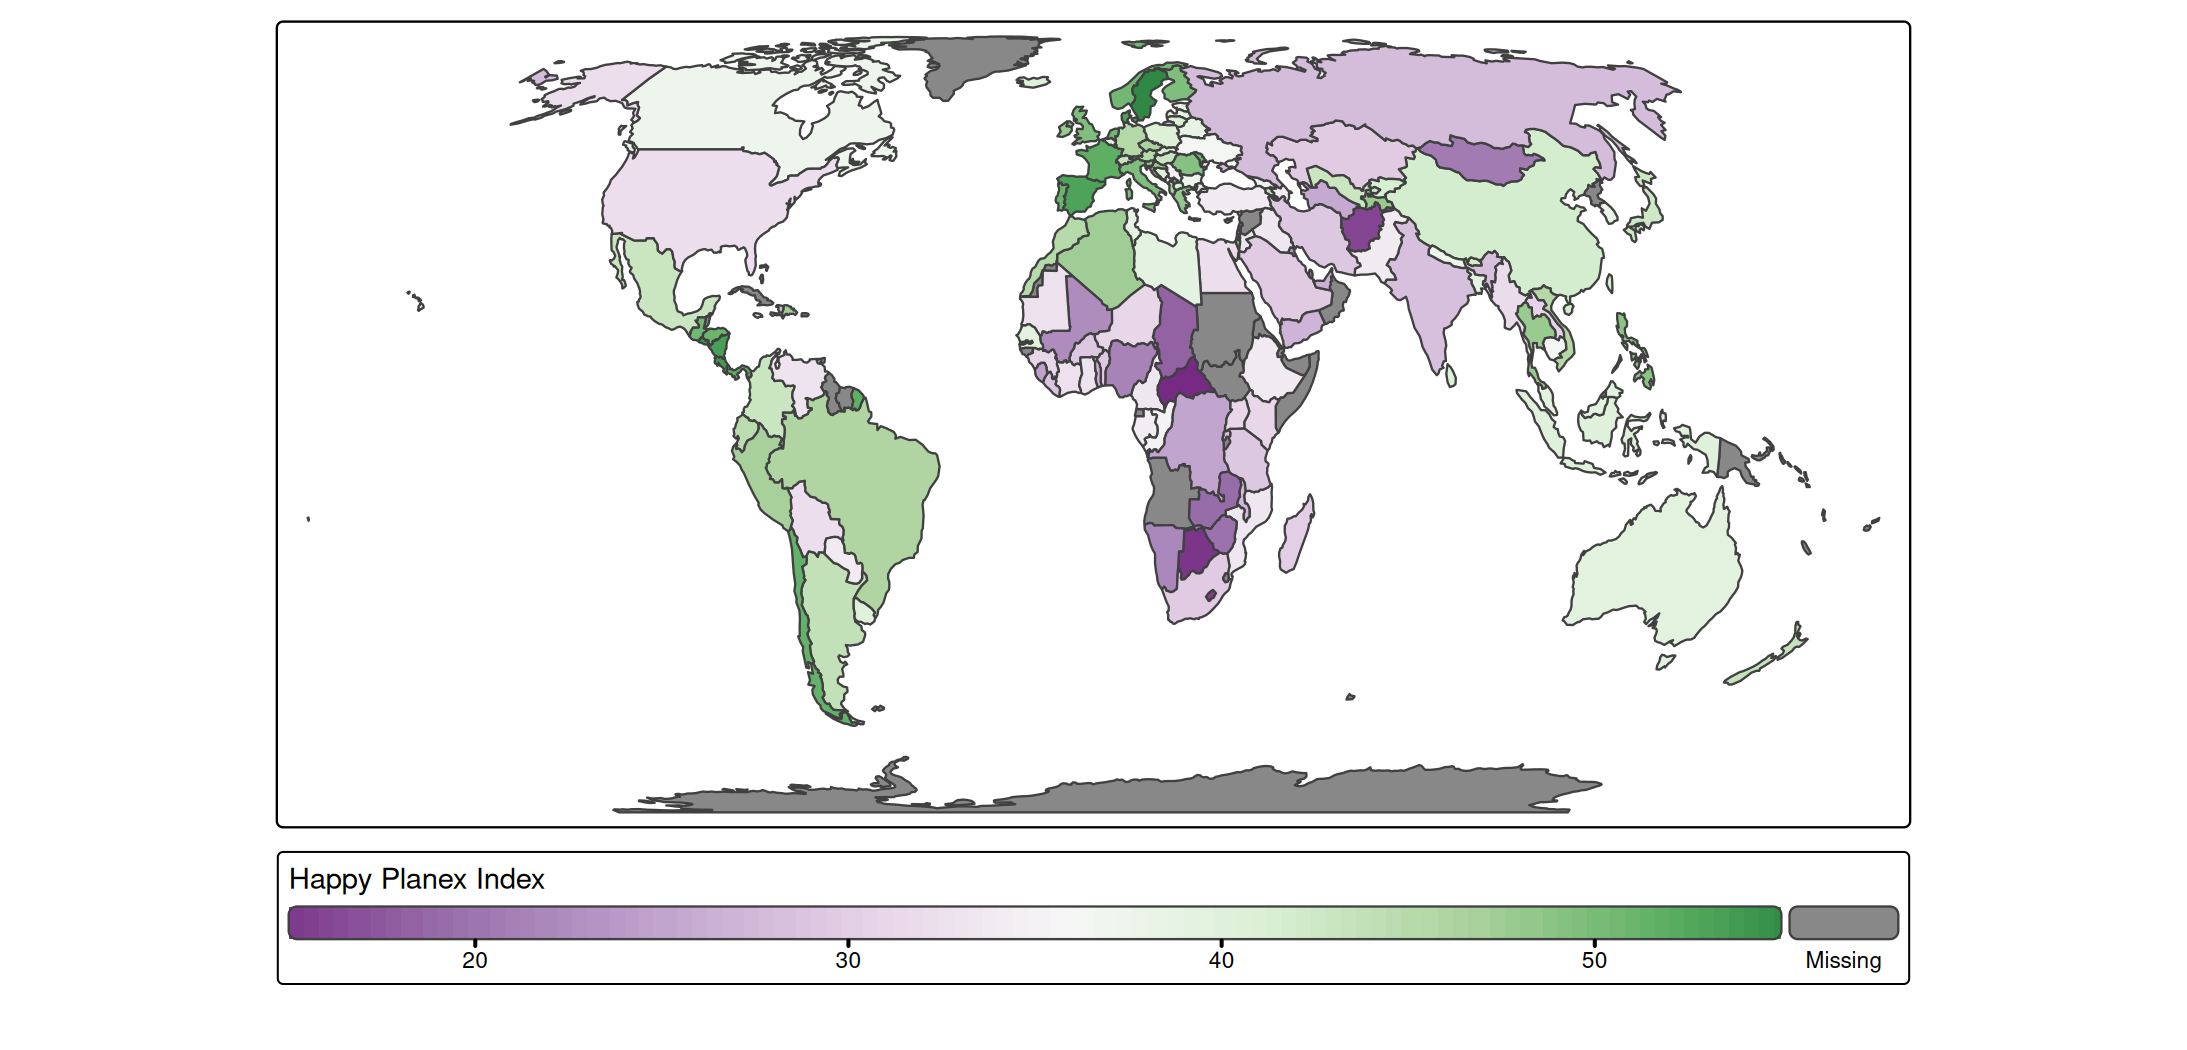
For tm_scale_intervals, there are two styles. A choice can be made via the argument label.style. By default it is set to discrete:
s + tm_polygons(
  fill = "HPI",
  fill.scale = tm_scale_intervals(values = "pu_gn"))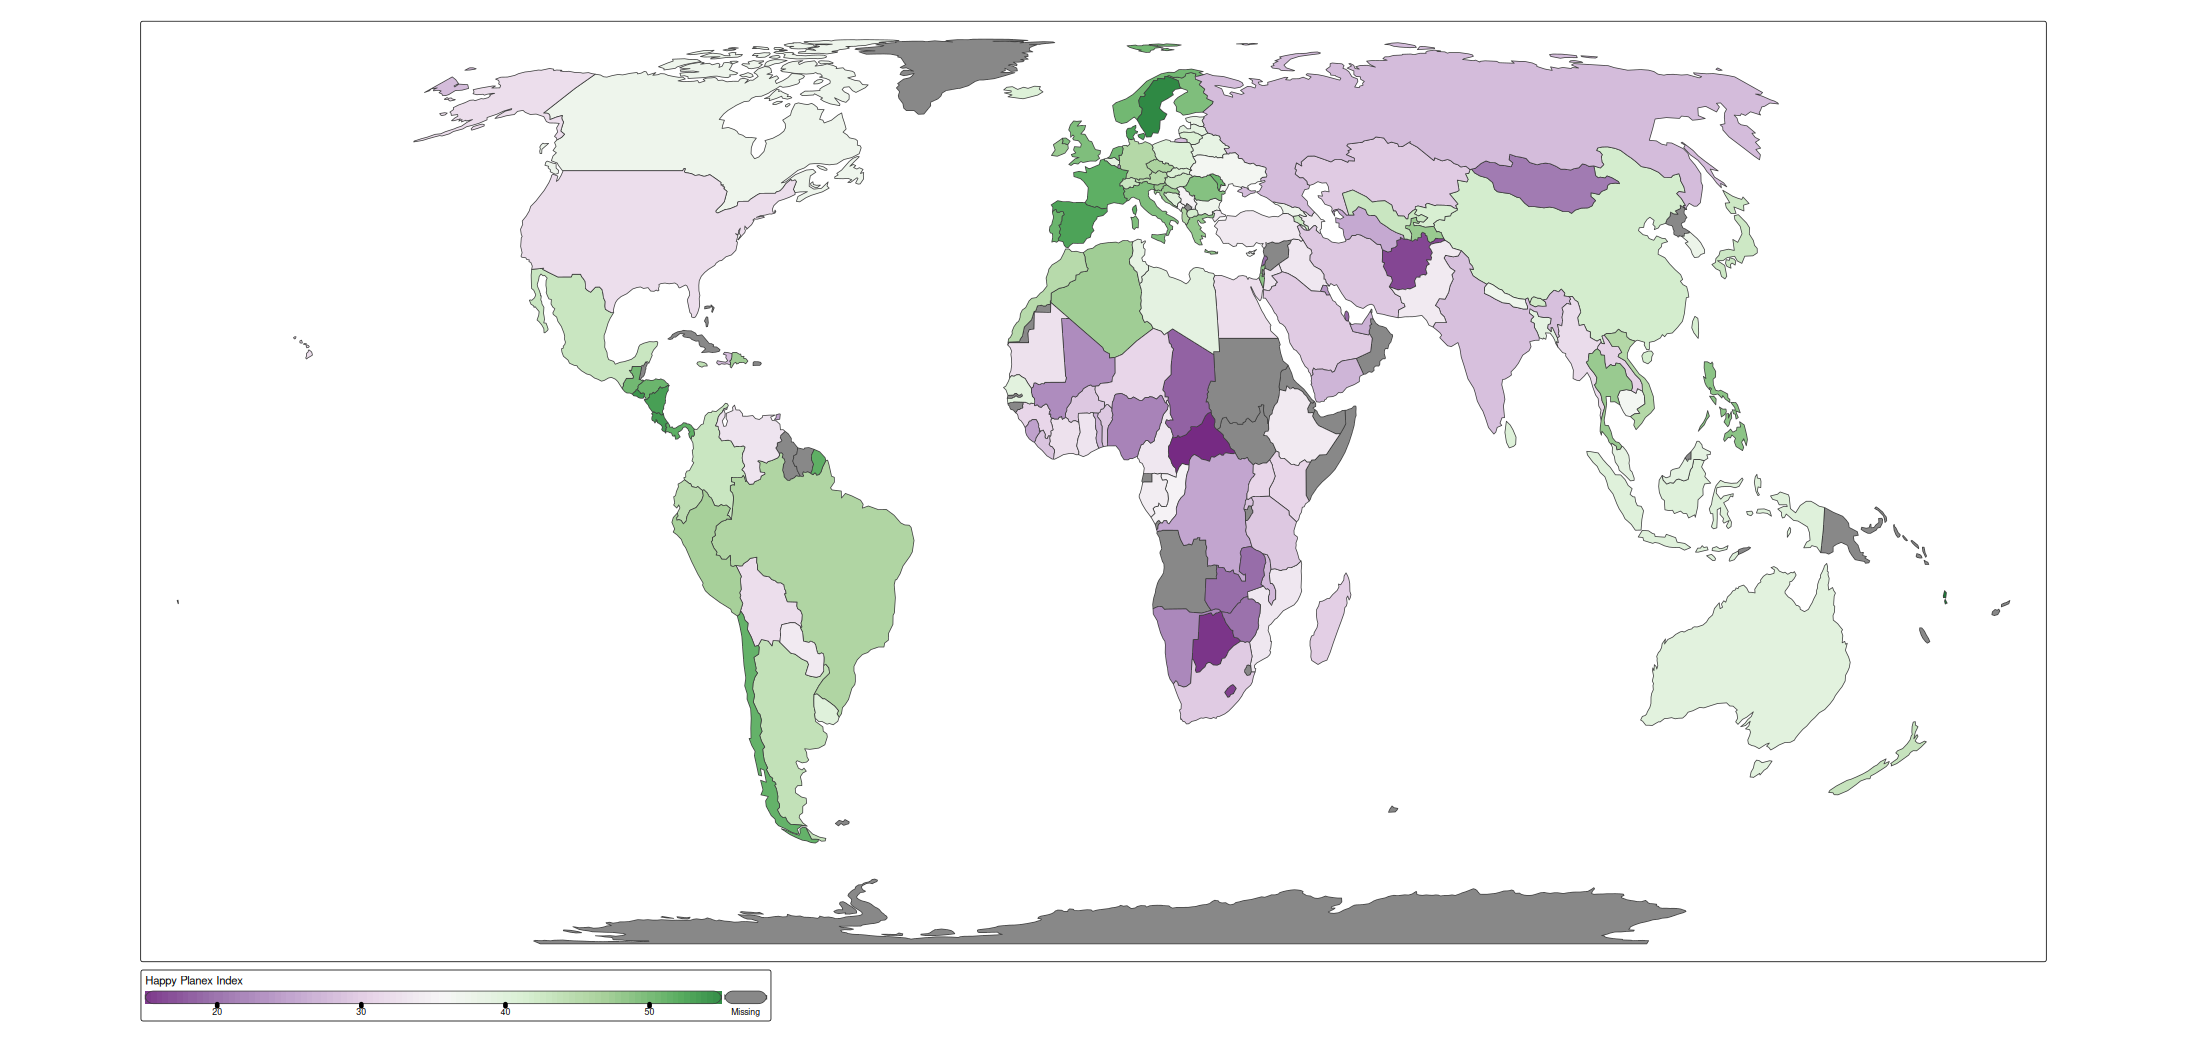
Alternatively, it can be set to "continuous":
s + tm_polygons(
  fill = "HPI",
  fill.scale = tm_scale_intervals(values = "pu_gn", label.style = "continuous"))
.legend arguments
Each map variable also has a .legend argument, such as fill.legend in tm_polygons. This can be used to:
- set the title of the legend,
- change the orientation of the legend (portrait or landscape),
- reverse the legend items,
- hide the legend, and
- change the size and position of the legend.
Note that the content of the legend, so breaks, scales, and ticks are related to the scale and should therefore be specified in the scale functions.
Title, orientation and size
The following example illustrates how the title, orientation and size and specified:
s + tm_polygons(
  fill = "HPI",
  fill.scale = tm_scale_continuous(values = "pu_gn"),
  fill.legend =
    tm_legend(
      title = "Happy Planex Index",
      orientation = "landscape",
      width = 60))
#> [plot mode] fit legend/component: Some legend items or map compoments do not
#> fit well, and are therefore rescaled.
#> ℹ Set the tmap option `component.autoscale = FALSE` to disable rescaling.
The legend width is set in number of text line heights, which corresponds to the number of characters. In other words, the resulting width depends on the font size, which can be set in tm_legend, but also via the general scale option, which determines the overall ‘scale’ of the map (all line widths, point sizes and font sizes):
s + tm_polygons(
  fill = "HPI",
  fill.scale = tm_scale_continuous(values = "pu_gn"),
  fill.legend =
    tm_legend(
      title = "Happy Planex Index",
      orientation = "landscape",
      width = 60)) +
tm_layout(scale = 0.25)
Hiding legends
A legend can be suppressed by setting the .legend argument to tm_legend_hide().
s + tm_polygons(
  fill = "HPI",
  fill.scale = tm_scale_continuous(values = "pu_gn"),
  fill.legend = tm_legend_hide())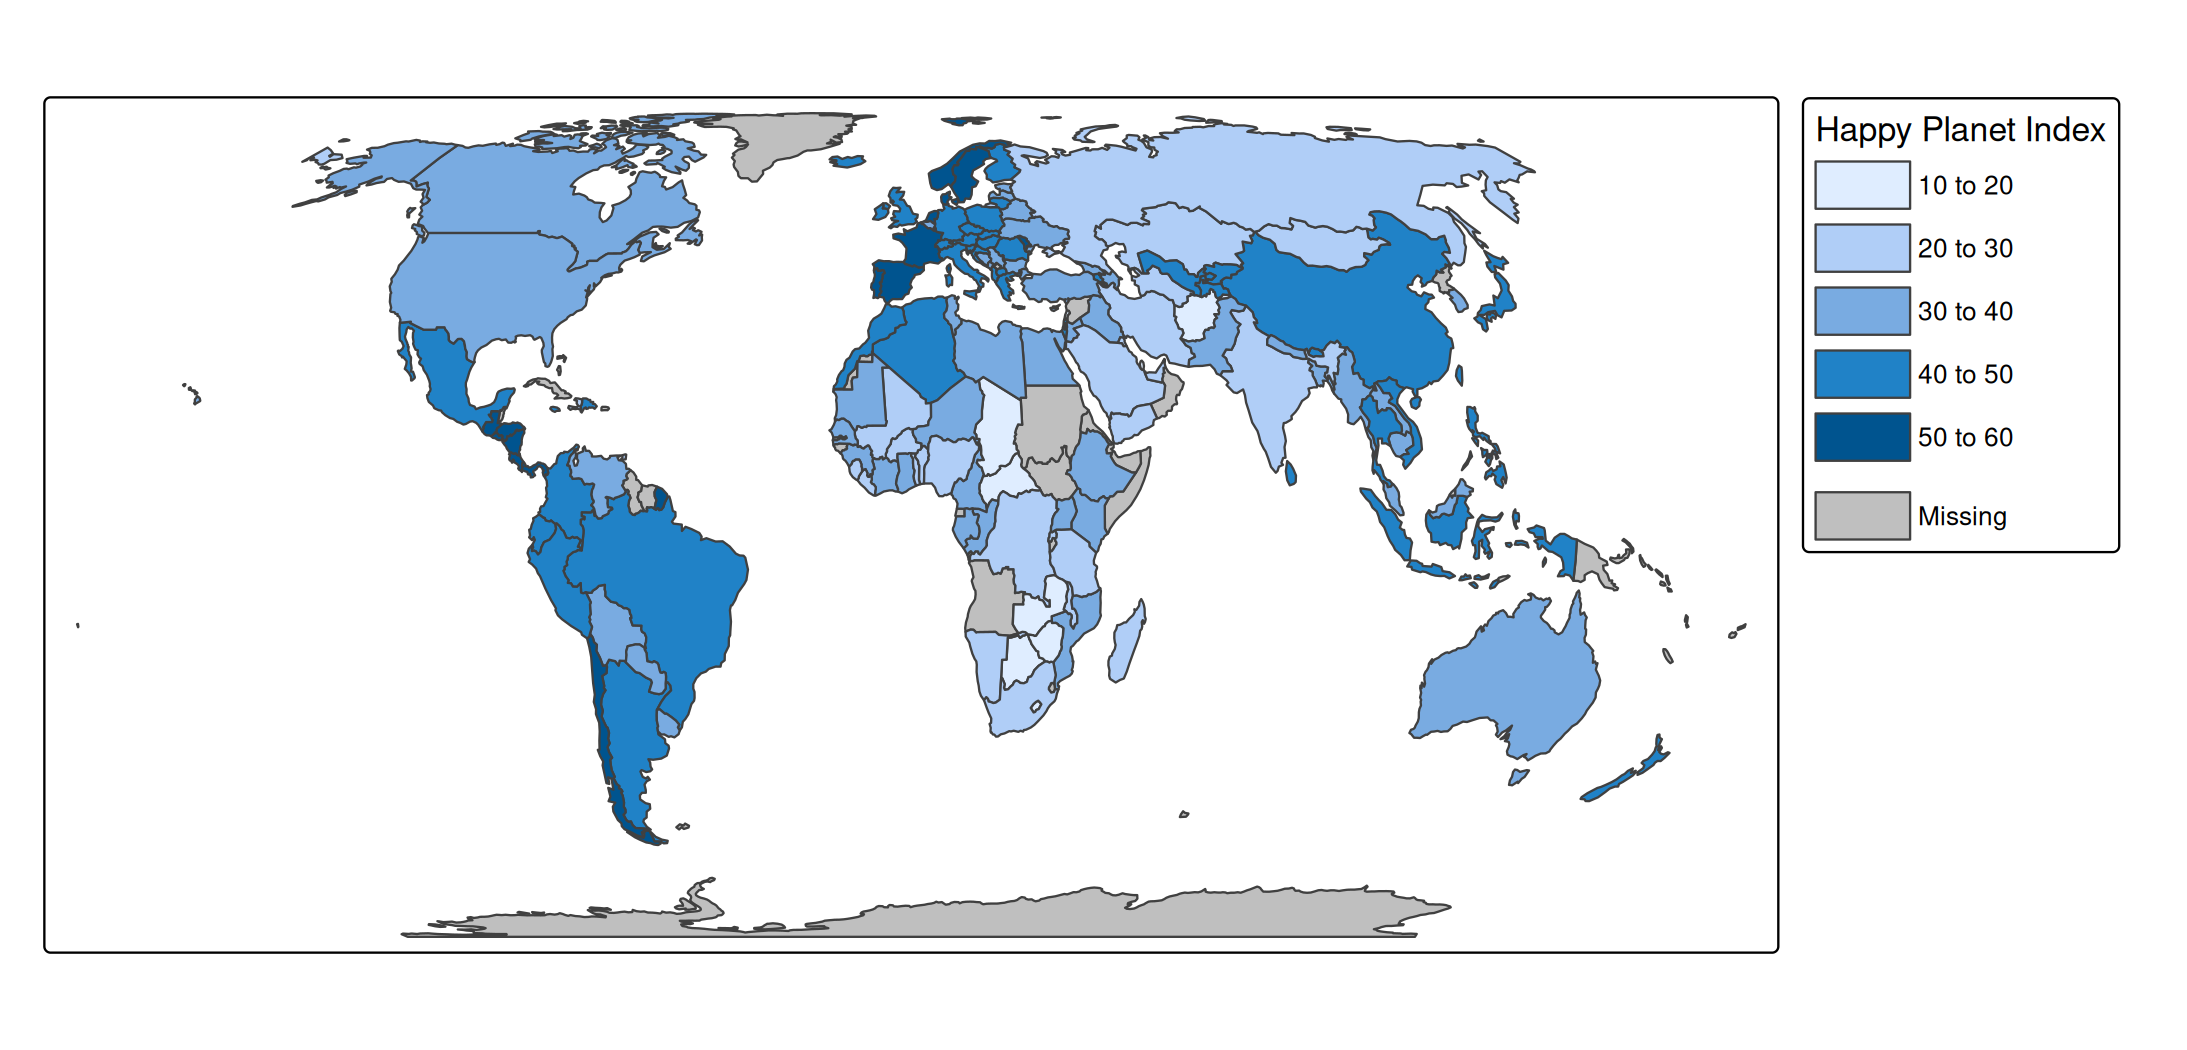
See the advanced vignette for more options.